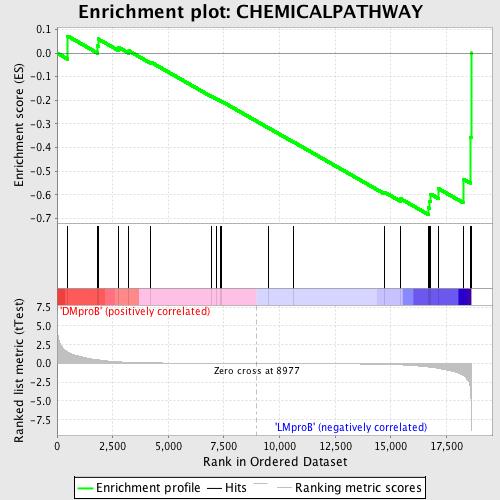
Profile of the Running ES Score & Positions of GeneSet Members on the Rank Ordered List
| Dataset | Set_04_DMproB_versus_LMproB.phenotype_DMproB_versus_LMproB.cls #DMproB_versus_LMproB |
| Phenotype | phenotype_DMproB_versus_LMproB.cls#DMproB_versus_LMproB |
| Upregulated in class | LMproB |
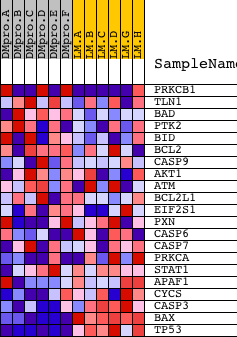
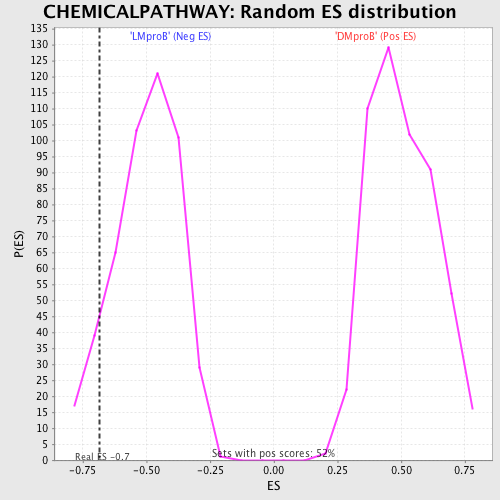
| GeneSet | CHEMICALPATHWAY |
| Enrichment Score (ES) | -0.6833891 |
| Normalized Enrichment Score (NES) | -1.3685563 |
| Nominal p-value | 0.09243698 |
| FDR q-value | 0.85224336 |
| FWER p-Value | 1.0 |
| PROBE | DESCRIPTION (from dataset) | GENE SYMBOL | GENE_TITLE | RANK IN GENE LIST | RANK METRIC SCORE | RUNNING ES | CORE ENRICHMENT | |
|---|---|---|---|---|---|---|---|---|
| 1 | PRKCB1 | 1693 9574 | 479 | 1.540 | 0.0718 | No | ||
| 2 | TLN1 | 15899 | 1827 | 0.487 | 0.0302 | No | ||
| 3 | BAD | 24000 | 1843 | 0.480 | 0.0599 | No | ||
| 4 | PTK2 | 22271 | 2777 | 0.217 | 0.0234 | No | ||
| 5 | BID | 17017 435 | 3229 | 0.158 | 0.0092 | No | ||
| 6 | BCL2 | 8651 3928 13864 4435 981 4062 13863 4027 | 4210 | 0.085 | -0.0381 | No | ||
| 7 | CASP9 | 16001 2410 2458 | 6938 | 0.023 | -0.1833 | No | ||
| 8 | AKT1 | 8568 | 7183 | 0.020 | -0.1951 | No | ||
| 9 | ATM | 2976 19115 | 7356 | 0.018 | -0.2032 | No | ||
| 10 | BCL2L1 | 4440 2930 8652 | 7407 | 0.017 | -0.2048 | No | ||
| 11 | EIF2S1 | 4658 | 9487 | -0.005 | -0.3163 | No | ||
| 12 | PXN | 5339 3573 | 10630 | -0.017 | -0.3767 | No | ||
| 13 | CASP6 | 15422 1885 | 14721 | -0.116 | -0.5893 | No | ||
| 14 | CASP7 | 23826 | 15422 | -0.177 | -0.6157 | No | ||
| 15 | PRKCA | 20174 | 16682 | -0.460 | -0.6543 | Yes | ||
| 16 | STAT1 | 3936 5524 | 16743 | -0.486 | -0.6267 | Yes | ||
| 17 | APAF1 | 8606 | 16795 | -0.511 | -0.5970 | Yes | ||
| 18 | CYCS | 8821 | 17152 | -0.657 | -0.5745 | Yes | ||
| 19 | CASP3 | 8693 | 18250 | -1.583 | -0.5332 | Yes | ||
| 20 | BAX | 17832 | 18570 | -3.065 | -0.3561 | Yes | ||
| 21 | TP53 | 20822 | 18609 | -5.657 | 0.0004 | Yes |