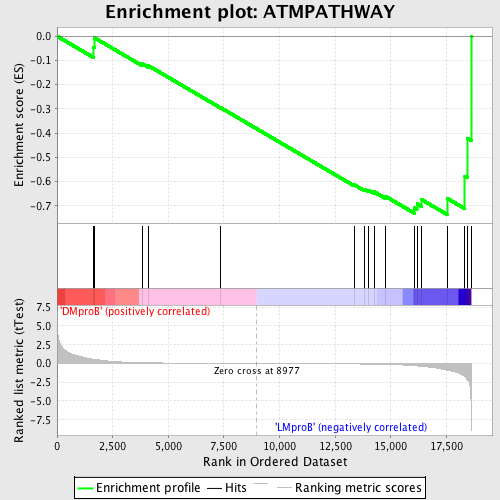
Profile of the Running ES Score & Positions of GeneSet Members on the Rank Ordered List
| Dataset | Set_04_DMproB_versus_LMproB.phenotype_DMproB_versus_LMproB.cls #DMproB_versus_LMproB |
| Phenotype | phenotype_DMproB_versus_LMproB.cls#DMproB_versus_LMproB |
| Upregulated in class | LMproB |
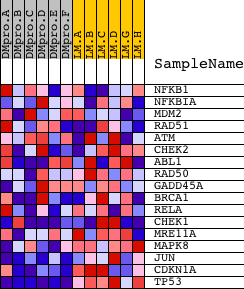
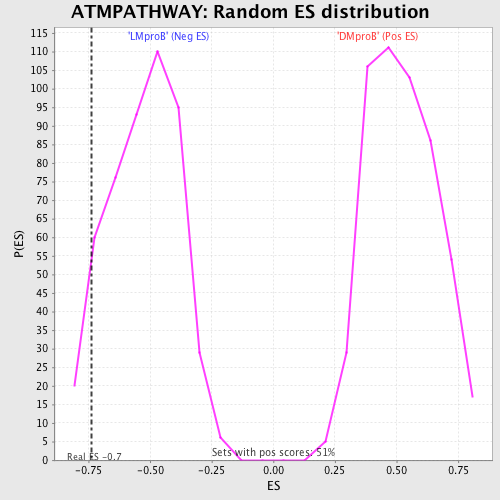
| GeneSet | ATMPATHWAY |
| Enrichment Score (ES) | -0.73560596 |
| Normalized Enrichment Score (NES) | -1.3970745 |
| Nominal p-value | 0.08384458 |
| FDR q-value | 0.795637 |
| FWER p-Value | 1.0 |
| PROBE | DESCRIPTION (from dataset) | GENE SYMBOL | GENE_TITLE | RANK IN GENE LIST | RANK METRIC SCORE | RUNNING ES | CORE ENRICHMENT | |
|---|---|---|---|---|---|---|---|---|
| 1 | NFKB1 | 15160 | 1638 | 0.564 | -0.0452 | No | ||
| 2 | NFKBIA | 21065 | 1694 | 0.538 | -0.0073 | No | ||
| 3 | MDM2 | 19620 3327 | 3820 | 0.107 | -0.1134 | No | ||
| 4 | RAD51 | 2897 14903 | 4111 | 0.090 | -0.1221 | No | ||
| 5 | ATM | 2976 19115 | 7356 | 0.018 | -0.2952 | No | ||
| 6 | CHEK2 | 16751 3587 | 13353 | -0.059 | -0.6130 | No | ||
| 7 | ABL1 | 2693 4301 2794 | 13814 | -0.075 | -0.6321 | No | ||
| 8 | RAD50 | 1198 20460 | 14006 | -0.082 | -0.6361 | No | ||
| 9 | GADD45A | 17129 | 14250 | -0.091 | -0.6423 | No | ||
| 10 | BRCA1 | 20213 | 14768 | -0.118 | -0.6611 | No | ||
| 11 | RELA | 23783 | 16057 | -0.286 | -0.7086 | Yes | ||
| 12 | CHEK1 | 19181 3085 | 16177 | -0.313 | -0.6913 | Yes | ||
| 13 | MRE11A | 3014 19560 | 16396 | -0.372 | -0.6747 | Yes | ||
| 14 | MAPK8 | 6459 | 17529 | -0.879 | -0.6688 | Yes | ||
| 15 | JUN | 15832 | 18330 | -1.748 | -0.5790 | Yes | ||
| 16 | CDKN1A | 4511 8729 | 18443 | -2.164 | -0.4206 | Yes | ||
| 17 | TP53 | 20822 | 18609 | -5.657 | 0.0004 | Yes |