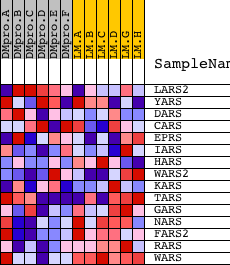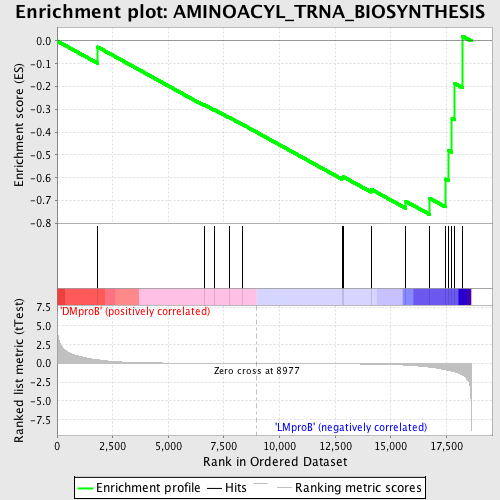
Profile of the Running ES Score & Positions of GeneSet Members on the Rank Ordered List
| Dataset | Set_04_DMproB_versus_LMproB.phenotype_DMproB_versus_LMproB.cls #DMproB_versus_LMproB |
| Phenotype | phenotype_DMproB_versus_LMproB.cls#DMproB_versus_LMproB |
| Upregulated in class | LMproB |
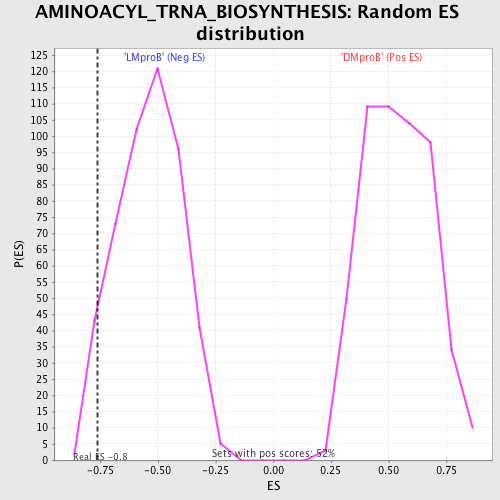
| GeneSet | AMINOACYL_TRNA_BIOSYNTHESIS |
| Enrichment Score (ES) | -0.7611886 |
| Normalized Enrichment Score (NES) | -1.4121414 |
| Nominal p-value | 0.057971016 |
| FDR q-value | 0.8481205 |
| FWER p-Value | 1.0 |
| PROBE | DESCRIPTION (from dataset) | GENE SYMBOL | GENE_TITLE | RANK IN GENE LIST | RANK METRIC SCORE | RUNNING ES | CORE ENRICHMENT | |
|---|---|---|---|---|---|---|---|---|
| 1 | LARS2 | 19255 | 1822 | 0.491 | -0.0264 | No | ||
| 2 | YARS | 16071 | 6617 | 0.027 | -0.2801 | No | ||
| 3 | DARS | 10375 13846 | 7080 | 0.021 | -0.3019 | No | ||
| 4 | CARS | 1683 17544 | 7749 | 0.013 | -0.3359 | No | ||
| 5 | EPRS | 14014 | 8319 | 0.007 | -0.3655 | No | ||
| 6 | IARS | 4190 8361 8362 | 12805 | -0.047 | -0.5997 | No | ||
| 7 | HARS | 23451 | 12868 | -0.048 | -0.5960 | No | ||
| 8 | WARS2 | 12884 7688 | 14109 | -0.086 | -0.6502 | No | ||
| 9 | KARS | 18738 | 15660 | -0.211 | -0.7028 | Yes | ||
| 10 | TARS | 22325 8502 | 16748 | -0.488 | -0.6901 | Yes | ||
| 11 | GARS | 17438 | 17447 | -0.838 | -0.6055 | Yes | ||
| 12 | NARS | 23418 | 17587 | -0.913 | -0.4799 | Yes | ||
| 13 | FARS2 | 21666 | 17748 | -1.018 | -0.3401 | Yes | ||
| 14 | RARS | 20496 | 17870 | -1.095 | -0.1870 | Yes | ||
| 15 | WARS | 2085 20984 | 18220 | -1.557 | 0.0213 | Yes |