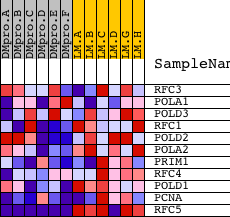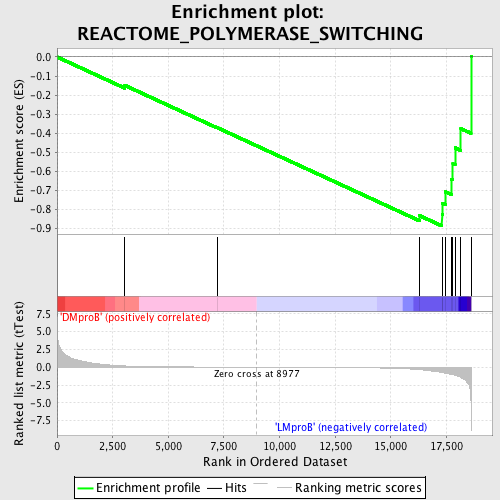
Profile of the Running ES Score & Positions of GeneSet Members on the Rank Ordered List
| Dataset | Set_04_DMproB_versus_LMproB.phenotype_DMproB_versus_LMproB.cls #DMproB_versus_LMproB |
| Phenotype | phenotype_DMproB_versus_LMproB.cls#DMproB_versus_LMproB |
| Upregulated in class | LMproB |
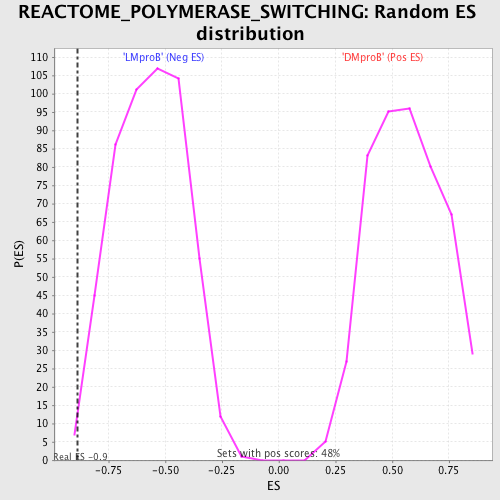
| GeneSet | REACTOME_POLYMERASE_SWITCHING |
| Enrichment Score (ES) | -0.8861994 |
| Normalized Enrichment Score (NES) | -1.5683761 |
| Nominal p-value | 0.005791506 |
| FDR q-value | 0.33395624 |
| FWER p-Value | 0.963 |
| PROBE | DESCRIPTION (from dataset) | GENE SYMBOL | GENE_TITLE | RANK IN GENE LIST | RANK METRIC SCORE | RUNNING ES | CORE ENRICHMENT | |
|---|---|---|---|---|---|---|---|---|
| 1 | RFC3 | 12786 | 3043 | 0.181 | -0.1490 | No | ||
| 2 | POLA1 | 24112 | 7186 | 0.020 | -0.3700 | No | ||
| 3 | POLD3 | 17742 | 16285 | -0.340 | -0.8317 | Yes | ||
| 4 | RFC1 | 16527 | 17300 | -0.738 | -0.8268 | Yes | ||
| 5 | POLD2 | 20537 | 17321 | -0.752 | -0.7675 | Yes | ||
| 6 | POLA2 | 23988 | 17453 | -0.841 | -0.7070 | Yes | ||
| 7 | PRIM1 | 19847 | 17717 | -1.000 | -0.6407 | Yes | ||
| 8 | RFC4 | 1735 22627 | 17791 | -1.042 | -0.5609 | Yes | ||
| 9 | POLD1 | 17847 | 17890 | -1.117 | -0.4764 | Yes | ||
| 10 | PCNA | 9535 | 18149 | -1.424 | -0.3759 | Yes | ||
| 11 | RFC5 | 13005 7791 | 18605 | -4.988 | 0.0006 | Yes |