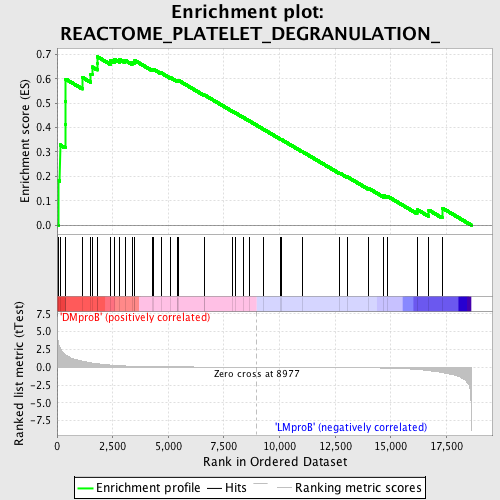
Profile of the Running ES Score & Positions of GeneSet Members on the Rank Ordered List
| Dataset | Set_04_DMproB_versus_LMproB.phenotype_DMproB_versus_LMproB.cls #DMproB_versus_LMproB |
| Phenotype | phenotype_DMproB_versus_LMproB.cls#DMproB_versus_LMproB |
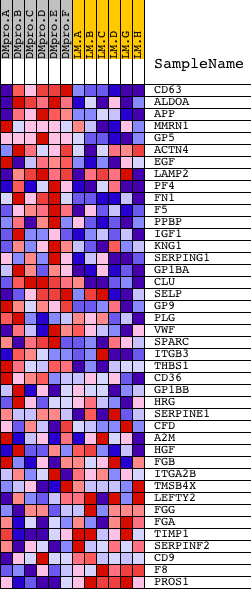
| Upregulated in class | DMproB |
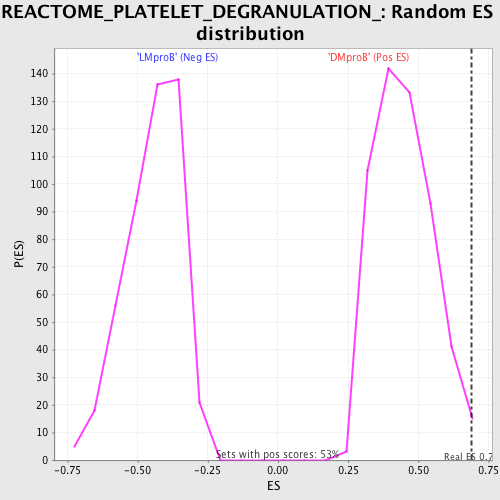
| GeneSet | REACTOME_PLATELET_DEGRANULATION_ |
| Enrichment Score (ES) | 0.68982995 |
| Normalized Enrichment Score (NES) | 1.53988 |
| Nominal p-value | 0.0056390977 |
| FDR q-value | 0.23180261 |
| FWER p-Value | 0.982 |
| PROBE | DESCRIPTION (from dataset) | GENE SYMBOL | GENE_TITLE | RANK IN GENE LIST | RANK METRIC SCORE | RUNNING ES | CORE ENRICHMENT | |
|---|---|---|---|---|---|---|---|---|
| 1 | CD63 | 8716 | 61 | 3.386 | 0.1832 | Yes | ||
| 2 | ALDOA | 8572 | 129 | 2.714 | 0.3291 | Yes | ||
| 3 | APP | 4402 | 365 | 1.743 | 0.4124 | Yes | ||
| 4 | MMRN1 | 17428 | 375 | 1.715 | 0.5064 | Yes | ||
| 5 | GP5 | 22616 | 389 | 1.685 | 0.5985 | Yes | ||
| 6 | ACTN4 | 17905 1798 1983 | 1141 | 0.856 | 0.6052 | Yes | ||
| 7 | EGF | 15169 | 1514 | 0.621 | 0.6194 | Yes | ||
| 8 | LAMP2 | 9267 2653 | 1578 | 0.591 | 0.6485 | Yes | ||
| 9 | PF4 | 16800 | 1812 | 0.494 | 0.6632 | Yes | ||
| 10 | FN1 | 4091 4094 971 13929 | 1820 | 0.491 | 0.6898 | Yes | ||
| 11 | F5 | 8941 | 2392 | 0.300 | 0.6756 | No | ||
| 12 | PPBP | 16801 | 2581 | 0.258 | 0.6797 | No | ||
| 13 | IGF1 | 3352 9156 3409 | 2811 | 0.211 | 0.6790 | No | ||
| 14 | KNG1 | 9244 22809 | 3052 | 0.180 | 0.6760 | No | ||
| 15 | SERPING1 | 14546 | 3371 | 0.144 | 0.6668 | No | ||
| 16 | GP1BA | 13683 | 3478 | 0.134 | 0.6684 | No | ||
| 17 | CLU | 21979 | 3493 | 0.132 | 0.6749 | No | ||
| 18 | SELP | 14073 | 4265 | 0.083 | 0.6380 | No | ||
| 19 | GP9 | 17374 | 4315 | 0.080 | 0.6398 | No | ||
| 20 | PLG | 1593 23383 | 4673 | 0.068 | 0.6243 | No | ||
| 21 | VWF | 17277 | 5076 | 0.057 | 0.6057 | No | ||
| 22 | SPARC | 20444 | 5411 | 0.049 | 0.5904 | No | ||
| 23 | ITGB3 | 20631 | 5429 | 0.048 | 0.5922 | No | ||
| 24 | THBS1 | 5748 14910 | 5461 | 0.047 | 0.5931 | No | ||
| 25 | CD36 | 8712 | 6622 | 0.027 | 0.5321 | No | ||
| 26 | GP1BB | 9031 | 6623 | 0.027 | 0.5336 | No | ||
| 27 | HRG | 22810 | 7874 | 0.012 | 0.4670 | No | ||
| 28 | SERPINE1 | 16333 | 8035 | 0.010 | 0.4589 | No | ||
| 29 | CFD | 19957 | 8366 | 0.006 | 0.4415 | No | ||
| 30 | A2M | 17298 | 8647 | 0.003 | 0.4266 | No | ||
| 31 | HGF | 16916 | 9274 | -0.003 | 0.3931 | No | ||
| 32 | FGB | 15309 | 10046 | -0.010 | 0.3522 | No | ||
| 33 | ITGA2B | 9186 | 10073 | -0.011 | 0.3513 | No | ||
| 34 | TMSB4X | 24005 | 11009 | -0.021 | 0.3022 | No | ||
| 35 | LEFTY2 | 6735 | 12705 | -0.045 | 0.2134 | No | ||
| 36 | FGG | 1891 | 13045 | -0.052 | 0.1980 | No | ||
| 37 | FGA | 1780 15566 | 14018 | -0.082 | 0.1502 | No | ||
| 38 | TIMP1 | 24366 | 14692 | -0.114 | 0.1202 | No | ||
| 39 | SERPINF2 | 9589 20348 | 14840 | -0.123 | 0.1191 | No | ||
| 40 | CD9 | 16992 | 16178 | -0.313 | 0.0644 | No | ||
| 41 | F8 | 2584 24123 | 16708 | -0.469 | 0.0617 | No | ||
| 42 | PROS1 | 22725 | 17309 | -0.744 | 0.0704 | No |