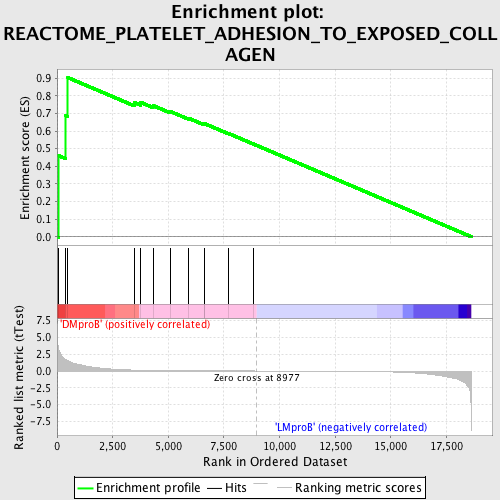
Profile of the Running ES Score & Positions of GeneSet Members on the Rank Ordered List
| Dataset | Set_04_DMproB_versus_LMproB.phenotype_DMproB_versus_LMproB.cls #DMproB_versus_LMproB |
| Phenotype | phenotype_DMproB_versus_LMproB.cls#DMproB_versus_LMproB |
| Upregulated in class | DMproB |
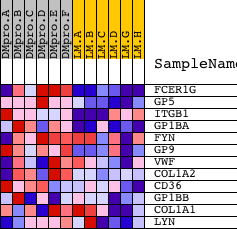
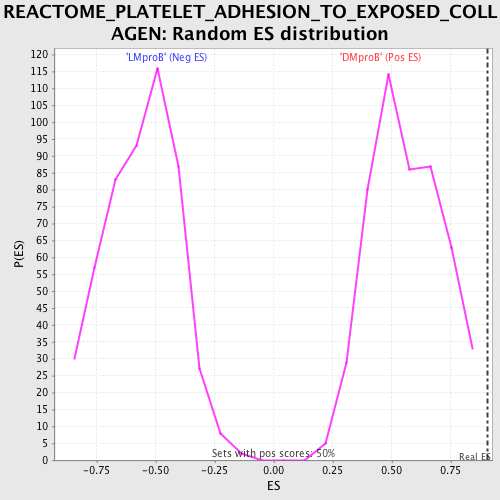
| GeneSet | REACTOME_PLATELET_ADHESION_TO_EXPOSED_COLLAGEN |
| Enrichment Score (ES) | 0.9034366 |
| Normalized Enrichment Score (NES) | 1.6077205 |
| Nominal p-value | 0.0 |
| FDR q-value | 0.17994747 |
| FWER p-Value | 0.776 |
| PROBE | DESCRIPTION (from dataset) | GENE SYMBOL | GENE_TITLE | RANK IN GENE LIST | RANK METRIC SCORE | RUNNING ES | CORE ENRICHMENT | |
|---|---|---|---|---|---|---|---|---|
| 1 | FCER1G | 13759 | 73 | 3.213 | 0.4600 | Yes | ||
| 2 | GP5 | 22616 | 389 | 1.685 | 0.6864 | Yes | ||
| 3 | ITGB1 | 3872 18411 | 482 | 1.537 | 0.9034 | Yes | ||
| 4 | GP1BA | 13683 | 3478 | 0.134 | 0.7617 | No | ||
| 5 | FYN | 3375 3395 20052 | 3756 | 0.112 | 0.7630 | No | ||
| 6 | GP9 | 17374 | 4315 | 0.080 | 0.7446 | No | ||
| 7 | VWF | 17277 | 5076 | 0.057 | 0.7119 | No | ||
| 8 | COL1A2 | 8772 | 5895 | 0.039 | 0.6736 | No | ||
| 9 | CD36 | 8712 | 6622 | 0.027 | 0.6384 | No | ||
| 10 | GP1BB | 9031 | 6623 | 0.027 | 0.6423 | No | ||
| 11 | COL1A1 | 8771 | 7712 | 0.014 | 0.5858 | No | ||
| 12 | LYN | 16281 | 8848 | 0.001 | 0.5250 | No |