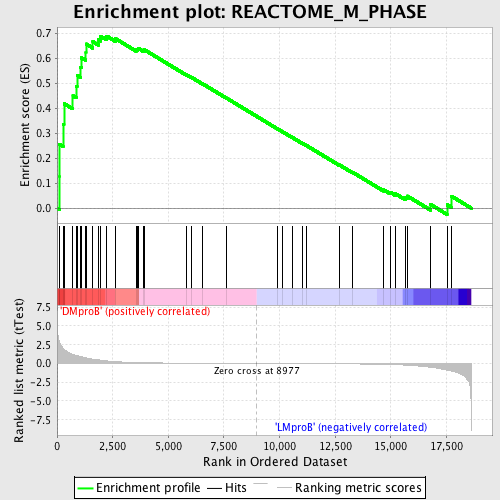
Profile of the Running ES Score & Positions of GeneSet Members on the Rank Ordered List
| Dataset | Set_04_DMproB_versus_LMproB.phenotype_DMproB_versus_LMproB.cls #DMproB_versus_LMproB |
| Phenotype | phenotype_DMproB_versus_LMproB.cls#DMproB_versus_LMproB |
| Upregulated in class | DMproB |
| GeneSet | REACTOME_M_PHASE |
| Enrichment Score (ES) | 0.6877767 |
| Normalized Enrichment Score (NES) | 1.5606383 |
| Nominal p-value | 0.021868788 |
| FDR q-value | 0.20461649 |
| FWER p-Value | 0.961 |
| PROBE | DESCRIPTION (from dataset) | GENE SYMBOL | GENE_TITLE | RANK IN GENE LIST | RANK METRIC SCORE | RUNNING ES | CORE ENRICHMENT | |
|---|---|---|---|---|---|---|---|---|
| 1 | CDC20 | 8421 8422 4227 | 101 | 2.960 | 0.1261 | Yes | ||
| 2 | SGOL2 | 14247 | 105 | 2.913 | 0.2554 | Yes | ||
| 3 | NUP160 | 14957 | 270 | 2.003 | 0.3355 | Yes | ||
| 4 | RANGAP1 | 2180 22195 | 310 | 1.906 | 0.4181 | Yes | ||
| 5 | MAD2L1 | 17422 | 713 | 1.179 | 0.4489 | Yes | ||
| 6 | BUB1B | 14908 | 858 | 1.047 | 0.4876 | Yes | ||
| 7 | KIF23 | 19091 | 897 | 1.024 | 0.5311 | Yes | ||
| 8 | ZWINT | 19992 | 1061 | 0.920 | 0.5632 | Yes | ||
| 9 | BIRC5 | 8611 8610 4399 | 1097 | 0.892 | 0.6009 | Yes | ||
| 10 | PPP1CC | 9609 5283 | 1296 | 0.747 | 0.6235 | Yes | ||
| 11 | ZW10 | 3114 19464 | 1299 | 0.742 | 0.6564 | Yes | ||
| 12 | PMF1 | 12452 | 1608 | 0.576 | 0.6654 | Yes | ||
| 13 | MLF1IP | 18622 | 1860 | 0.477 | 0.6731 | Yes | ||
| 14 | SGOL1 | 7810 7809 13030 | 1956 | 0.433 | 0.6872 | Yes | ||
| 15 | NUP107 | 8337 | 2231 | 0.345 | 0.6878 | Yes | ||
| 16 | NDC80 | 22900 | 2633 | 0.246 | 0.6771 | No | ||
| 17 | STAG2 | 5521 | 3550 | 0.126 | 0.6334 | No | ||
| 18 | KIF2B | 20295 | 3607 | 0.122 | 0.6358 | No | ||
| 19 | NUP43 | 20094 | 3644 | 0.119 | 0.6391 | No | ||
| 20 | KIF20A | 23602 | 3902 | 0.102 | 0.6298 | No | ||
| 21 | XPO1 | 4172 | 3925 | 0.101 | 0.6331 | No | ||
| 22 | BUB3 | 18045 | 5816 | 0.041 | 0.5332 | No | ||
| 23 | RAD21 | 22298 | 6019 | 0.037 | 0.5240 | No | ||
| 24 | CENPE | 15414 | 6539 | 0.028 | 0.4973 | No | ||
| 25 | KIF2A | 9217 11438 | 7620 | 0.015 | 0.4398 | No | ||
| 26 | BUB1 | 8665 | 9897 | -0.009 | 0.3177 | No | ||
| 27 | SMC1A | 2572 24225 6279 10780 | 10146 | -0.011 | 0.3048 | No | ||
| 28 | NUP37 | 3294 3326 19909 | 10568 | -0.016 | 0.2829 | No | ||
| 29 | CDCA8 | 11966 6977 | 11027 | -0.021 | 0.2591 | No | ||
| 30 | PLK1 | 9590 5266 | 11214 | -0.024 | 0.2502 | No | ||
| 31 | CENPC1 | 8737 | 12686 | -0.045 | 0.1730 | No | ||
| 32 | CLASP2 | 13338 | 13263 | -0.057 | 0.1445 | No | ||
| 33 | KNTC1 | 16705 | 14677 | -0.113 | 0.0735 | No | ||
| 34 | SEC13 | 17039 | 14980 | -0.134 | 0.0632 | No | ||
| 35 | CLIP1 | 3603 7121 | 15198 | -0.153 | 0.0583 | No | ||
| 36 | CLASP1 | 14159 | 15670 | -0.212 | 0.0424 | No | ||
| 37 | RANBP2 | 20019 | 15737 | -0.224 | 0.0488 | No | ||
| 38 | CENPA | 8736 | 16788 | -0.506 | 0.0147 | No | ||
| 39 | MAPRE1 | 4652 | 17530 | -0.879 | 0.0139 | No | ||
| 40 | PAFAH1B1 | 1340 5220 9524 | 17724 | -1.001 | 0.0480 | No |

