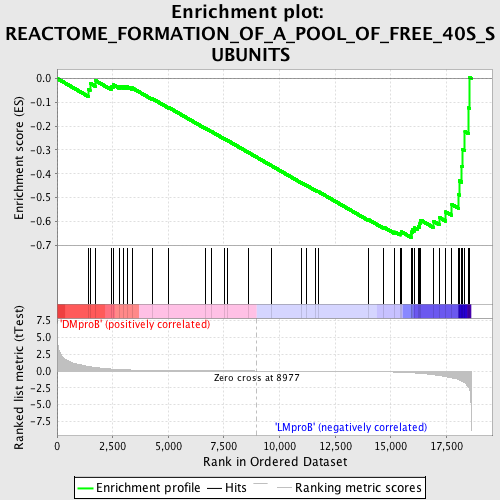
Profile of the Running ES Score & Positions of GeneSet Members on the Rank Ordered List
| Dataset | Set_04_DMproB_versus_LMproB.phenotype_DMproB_versus_LMproB.cls #DMproB_versus_LMproB |
| Phenotype | phenotype_DMproB_versus_LMproB.cls#DMproB_versus_LMproB |
| Upregulated in class | LMproB |
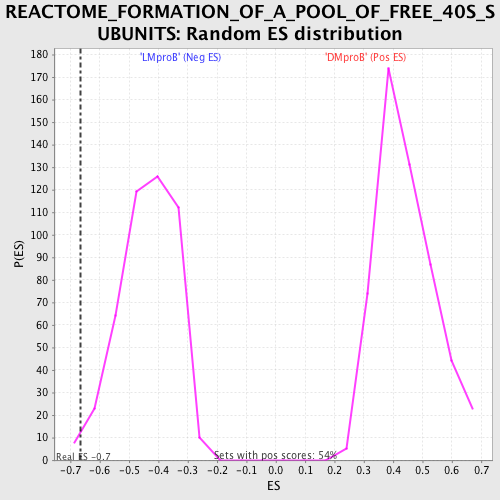
| GeneSet | REACTOME_FORMATION_OF_A_POOL_OF_FREE_40S_SUBUNITS |
| Enrichment Score (ES) | -0.66677684 |
| Normalized Enrichment Score (NES) | -1.5333371 |
| Nominal p-value | 0.010822511 |
| FDR q-value | 0.29677442 |
| FWER p-Value | 0.995 |
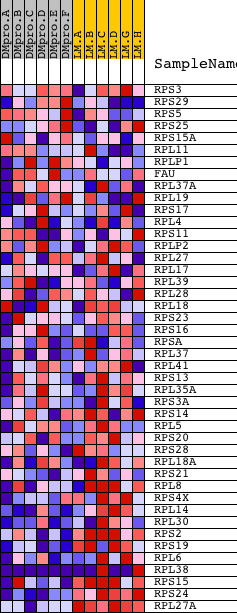
| PROBE | DESCRIPTION (from dataset) | GENE SYMBOL | GENE_TITLE | RANK IN GENE LIST | RANK METRIC SCORE | RUNNING ES | CORE ENRICHMENT | |
|---|---|---|---|---|---|---|---|---|
| 1 | RPS3 | 6549 11295 | 1418 | 0.673 | -0.0457 | No | ||
| 2 | RPS29 | 9754 | 1483 | 0.636 | -0.0202 | No | ||
| 3 | RPS5 | 18391 | 1719 | 0.529 | -0.0087 | No | ||
| 4 | RPS25 | 13270 | 2457 | 0.285 | -0.0354 | No | ||
| 5 | RPS15A | 6476 | 2521 | 0.271 | -0.0264 | No | ||
| 6 | RPL11 | 12450 | 2808 | 0.212 | -0.0322 | No | ||
| 7 | RPLP1 | 3010 | 2986 | 0.189 | -0.0331 | No | ||
| 8 | FAU | 8954 | 3142 | 0.168 | -0.0338 | No | ||
| 9 | RPL37A | 9744 | 3372 | 0.144 | -0.0396 | No | ||
| 10 | RPL19 | 9736 | 4283 | 0.082 | -0.0849 | No | ||
| 11 | RPS17 | 9753 | 5024 | 0.058 | -0.1221 | No | ||
| 12 | RPL4 | 7499 19411 | 6687 | 0.026 | -0.2104 | No | ||
| 13 | RPS11 | 11317 | 6951 | 0.023 | -0.2235 | No | ||
| 14 | RPLP2 | 7401 | 7509 | 0.016 | -0.2527 | No | ||
| 15 | RPL27 | 9740 | 7642 | 0.015 | -0.2592 | No | ||
| 16 | RPL17 | 11429 6653 | 8584 | 0.004 | -0.3097 | No | ||
| 17 | RPL39 | 12496 | 9626 | -0.006 | -0.3654 | No | ||
| 18 | RPL28 | 5392 | 10987 | -0.021 | -0.4377 | No | ||
| 19 | RPL18 | 450 5390 | 11188 | -0.023 | -0.4474 | No | ||
| 20 | RPS23 | 12352 | 11610 | -0.029 | -0.4688 | No | ||
| 21 | RPS16 | 9752 | 11747 | -0.030 | -0.4747 | No | ||
| 22 | RPSA | 19270 4984 | 13981 | -0.081 | -0.5913 | No | ||
| 23 | RPL37 | 12502 7421 22521 | 14669 | -0.112 | -0.6232 | No | ||
| 24 | RPL41 | 12611 | 15183 | -0.152 | -0.6439 | No | ||
| 25 | RPS13 | 12633 | 15419 | -0.177 | -0.6485 | No | ||
| 26 | RPL35A | 12194 | 15472 | -0.184 | -0.6429 | No | ||
| 27 | RPS3A | 9755 | 15917 | -0.254 | -0.6552 | Yes | ||
| 28 | RPS14 | 9751 | 15920 | -0.255 | -0.6437 | Yes | ||
| 29 | RPL5 | 9746 | 15976 | -0.266 | -0.6346 | Yes | ||
| 30 | RPS20 | 7438 | 16077 | -0.290 | -0.6267 | Yes | ||
| 31 | RPS28 | 12009 | 16221 | -0.324 | -0.6197 | Yes | ||
| 32 | RPL18A | 13358 | 16304 | -0.347 | -0.6083 | Yes | ||
| 33 | RPS21 | 12356 | 16336 | -0.356 | -0.5938 | Yes | ||
| 34 | RPL8 | 22437 | 16925 | -0.560 | -0.5999 | Yes | ||
| 35 | RPS4X | 9756 | 17191 | -0.675 | -0.5834 | Yes | ||
| 36 | RPL14 | 19267 | 17467 | -0.846 | -0.5597 | Yes | ||
| 37 | RPL30 | 9742 | 17741 | -1.012 | -0.5283 | Yes | ||
| 38 | RPS2 | 9279 | 18035 | -1.253 | -0.4870 | Yes | ||
| 39 | RPS19 | 5398 | 18077 | -1.312 | -0.4294 | Yes | ||
| 40 | RPL6 | 9747 | 18187 | -1.491 | -0.3674 | Yes | ||
| 41 | RPL38 | 12562 20606 7475 | 18235 | -1.575 | -0.2982 | Yes | ||
| 42 | RPS15 | 5396 | 18332 | -1.752 | -0.2235 | Yes | ||
| 43 | RPS24 | 5399 | 18502 | -2.395 | -0.1235 | Yes | ||
| 44 | RPL27A | 11181 6467 18130 | 18549 | -2.846 | 0.0036 | Yes |