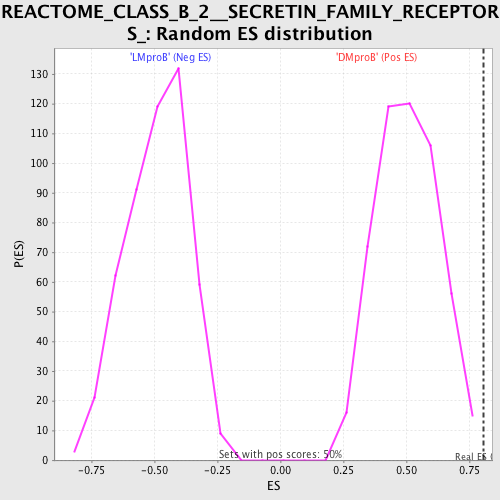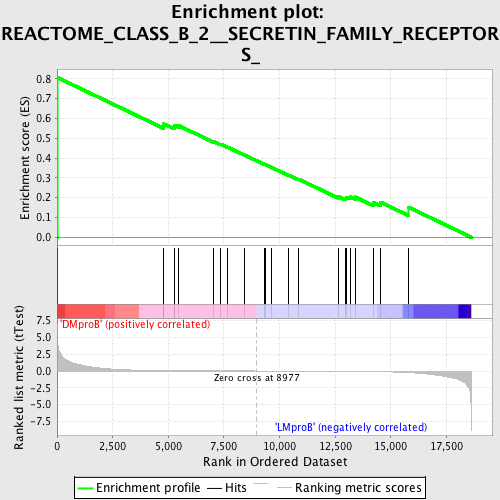
Profile of the Running ES Score & Positions of GeneSet Members on the Rank Ordered List
| Dataset | Set_04_DMproB_versus_LMproB.phenotype_DMproB_versus_LMproB.cls #DMproB_versus_LMproB |
| Phenotype | phenotype_DMproB_versus_LMproB.cls#DMproB_versus_LMproB |
| Upregulated in class | DMproB |
| GeneSet | REACTOME_CLASS_B_2__SECRETIN_FAMILY_RECEPTORS_ |
| Enrichment Score (ES) | 0.8064112 |
| Normalized Enrichment Score (NES) | 1.6008823 |
| Nominal p-value | 0.0 |
| FDR q-value | 0.17819618 |
| FWER p-Value | 0.816 |
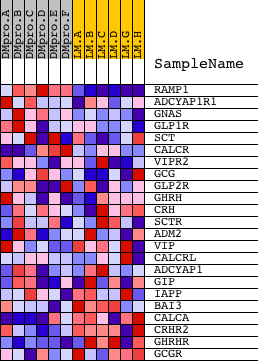
| PROBE | DESCRIPTION (from dataset) | GENE SYMBOL | GENE_TITLE | RANK IN GENE LIST | RANK METRIC SCORE | RUNNING ES | CORE ENRICHMENT | |
|---|---|---|---|---|---|---|---|---|
| 1 | RAMP1 | 14189 | 18 | 4.518 | 0.8064 | Yes | ||
| 2 | ADCYAP1R1 | 8553 1192 4349 | 4783 | 0.064 | 0.5617 | No | ||
| 3 | GNAS | 9025 2963 2752 | 4797 | 0.064 | 0.5723 | No | ||
| 4 | GLP1R | 23304 | 5259 | 0.052 | 0.5568 | No | ||
| 5 | SCT | 17560 | 5273 | 0.052 | 0.5654 | No | ||
| 6 | CALCR | 17229 | 5444 | 0.048 | 0.5648 | No | ||
| 7 | VIPR2 | 21125 | 7041 | 0.022 | 0.4828 | No | ||
| 8 | GCG | 14578 | 7323 | 0.018 | 0.4710 | No | ||
| 9 | GLP2R | 8227 13563 13564 | 7653 | 0.014 | 0.4559 | No | ||
| 10 | GHRH | 14372 | 8434 | 0.005 | 0.4149 | No | ||
| 11 | CRH | 8784 | 9300 | -0.004 | 0.3690 | No | ||
| 12 | SCTR | 14157 | 9359 | -0.004 | 0.3666 | No | ||
| 13 | ADM2 | 22388 | 9615 | -0.006 | 0.3540 | No | ||
| 14 | VIP | 20096 | 10404 | -0.014 | 0.3142 | No | ||
| 15 | CALCRL | 12041 | 10863 | -0.019 | 0.2930 | No | ||
| 16 | ADCYAP1 | 4348 | 12627 | -0.044 | 0.2060 | No | ||
| 17 | GIP | 76 | 12958 | -0.050 | 0.1972 | No | ||
| 18 | IAPP | 17249 | 13014 | -0.051 | 0.2034 | No | ||
| 19 | BAI3 | 5580 | 13194 | -0.055 | 0.2036 | No | ||
| 20 | CALCA | 4470 | 13398 | -0.061 | 0.2035 | No | ||
| 21 | CRHR2 | 17140 | 14215 | -0.090 | 0.1757 | No | ||
| 22 | GHRHR | 1007 17436 | 14530 | -0.105 | 0.1776 | No | ||
| 23 | GCGR | 20566 | 15808 | -0.236 | 0.1510 | No |