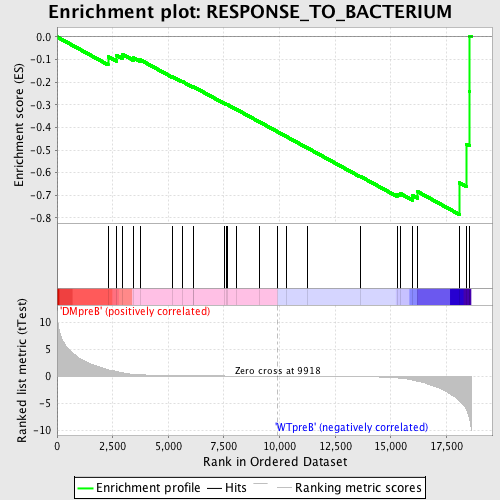
Profile of the Running ES Score & Positions of GeneSet Members on the Rank Ordered List
| Dataset | Set_04_DMpreB_versus_WTpreB.phenotype_DMpreB_versus_WTpreB.cls #DMpreB_versus_WTpreB |
| Phenotype | phenotype_DMpreB_versus_WTpreB.cls#DMpreB_versus_WTpreB |
| Upregulated in class | WTpreB |
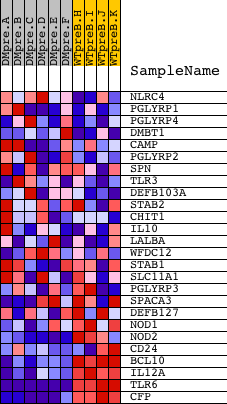
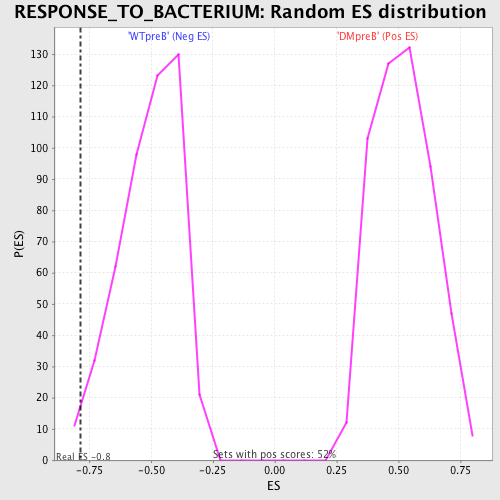
| GeneSet | RESPONSE_TO_BACTERIUM |
| Enrichment Score (ES) | -0.784572 |
| Normalized Enrichment Score (NES) | -1.5464271 |
| Nominal p-value | 0.016771488 |
| FDR q-value | 0.31784686 |
| FWER p-Value | 0.962 |
| PROBE | DESCRIPTION (from dataset) | GENE SYMBOL | GENE_TITLE | RANK IN GENE LIST | RANK METRIC SCORE | RUNNING ES | CORE ENRICHMENT | |
|---|---|---|---|---|---|---|---|---|
| 1 | NLRC4 | 11225 | 2293 | 1.186 | -0.0869 | No | ||
| 2 | PGLYRP1 | 18369 | 2674 | 0.839 | -0.0816 | No | ||
| 3 | PGLYRP4 | 11810 | 2939 | 0.611 | -0.0771 | No | ||
| 4 | DMBT1 | 18050 | 3424 | 0.347 | -0.0925 | No | ||
| 5 | CAMP | 18990 | 3743 | 0.263 | -0.1015 | No | ||
| 6 | PGLYRP2 | 7174 | 5195 | 0.102 | -0.1764 | No | ||
| 7 | SPN | 452 5493 | 5619 | 0.081 | -0.1967 | No | ||
| 8 | TLR3 | 18884 | 6126 | 0.063 | -0.2220 | No | ||
| 9 | DEFB103A | 18665 | 6128 | 0.063 | -0.2201 | No | ||
| 10 | STAB2 | 19656 | 7535 | 0.032 | -0.2948 | No | ||
| 11 | CHIT1 | 14132 | 7596 | 0.031 | -0.2970 | No | ||
| 12 | IL10 | 14145 1510 1553 22902 | 7653 | 0.030 | -0.2991 | No | ||
| 13 | LALBA | 22141 | 8074 | 0.024 | -0.3210 | No | ||
| 14 | WFDC12 | 14356 | 9101 | 0.011 | -0.3759 | No | ||
| 15 | STAB1 | 21892 | 9894 | 0.000 | -0.4184 | No | ||
| 16 | SLC11A1 | 5189 9483 5190 | 10306 | -0.005 | -0.4404 | No | ||
| 17 | PGLYRP3 | 10812 | 11246 | -0.018 | -0.4904 | No | ||
| 18 | SPACA3 | 13680 | 13623 | -0.079 | -0.6157 | No | ||
| 19 | DEFB127 | 622 | 15284 | -0.315 | -0.6954 | No | ||
| 20 | NOD1 | 17141 | 15422 | -0.361 | -0.6917 | No | ||
| 21 | NOD2 | 6384 | 15978 | -0.694 | -0.7002 | Yes | ||
| 22 | CD24 | 8711 | 16207 | -0.934 | -0.6838 | Yes | ||
| 23 | BCL10 | 15397 | 18081 | -4.569 | -0.6443 | Yes | ||
| 24 | IL12A | 4913 | 18393 | -6.118 | -0.4733 | Yes | ||
| 25 | TLR6 | 215 16528 | 18539 | -7.853 | -0.2400 | Yes | ||
| 26 | CFP | 24174 | 18550 | -7.954 | 0.0036 | Yes |