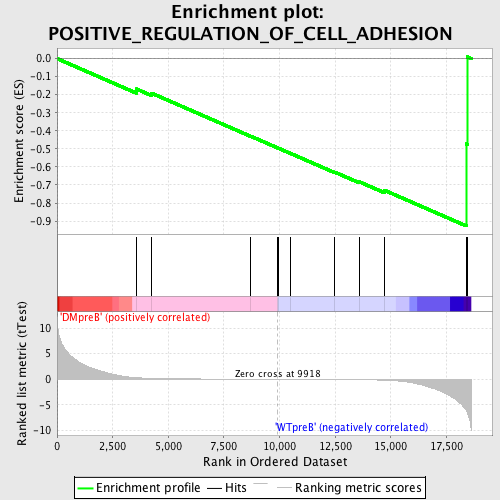
Profile of the Running ES Score & Positions of GeneSet Members on the Rank Ordered List
| Dataset | Set_04_DMpreB_versus_WTpreB.phenotype_DMpreB_versus_WTpreB.cls #DMpreB_versus_WTpreB |
| Phenotype | phenotype_DMpreB_versus_WTpreB.cls#DMpreB_versus_WTpreB |
| Upregulated in class | WTpreB |
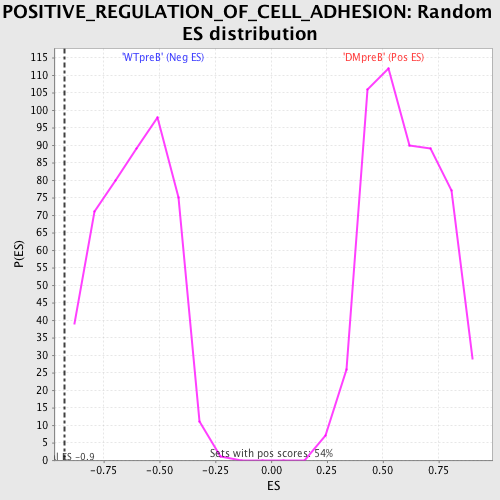
| GeneSet | POSITIVE_REGULATION_OF_CELL_ADHESION |
| Enrichment Score (ES) | -0.927192 |
| Normalized Enrichment Score (NES) | -1.5160145 |
| Nominal p-value | 0.0021551724 |
| FDR q-value | 0.31074446 |
| FWER p-Value | 0.994 |
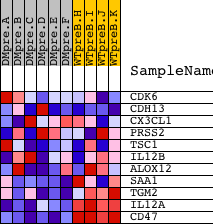
| PROBE | DESCRIPTION (from dataset) | GENE SYMBOL | GENE_TITLE | RANK IN GENE LIST | RANK METRIC SCORE | RUNNING ES | CORE ENRICHMENT | |
|---|---|---|---|---|---|---|---|---|
| 1 | CDK6 | 16600 | 3557 | 0.311 | -0.1681 | No | ||
| 2 | CDH13 | 4506 3826 | 4231 | 0.181 | -0.1908 | No | ||
| 3 | CX3CL1 | 9791 | 8684 | 0.015 | -0.4289 | No | ||
| 4 | PRSS2 | 17474 | 9892 | 0.000 | -0.4937 | No | ||
| 5 | TSC1 | 7235 | 9972 | -0.001 | -0.4979 | No | ||
| 6 | IL12B | 20918 | 10475 | -0.007 | -0.5244 | No | ||
| 7 | ALOX12 | 20372 | 12484 | -0.041 | -0.6293 | No | ||
| 8 | SAA1 | 9776 | 13575 | -0.077 | -0.6821 | No | ||
| 9 | TGM2 | 2657 | 14709 | -0.186 | -0.7292 | Yes | ||
| 10 | IL12A | 4913 | 18393 | -6.118 | -0.4726 | Yes | ||
| 11 | CD47 | 4933 | 18437 | -6.520 | 0.0096 | Yes |