Profile of the Running ES Score & Positions of GeneSet Members on the Rank Ordered List
| Dataset | Set_04_DMpreB_versus_WTpreB.phenotype_DMpreB_versus_WTpreB.cls #DMpreB_versus_WTpreB |
| Phenotype | phenotype_DMpreB_versus_WTpreB.cls#DMpreB_versus_WTpreB |
| Upregulated in class | DMpreB |
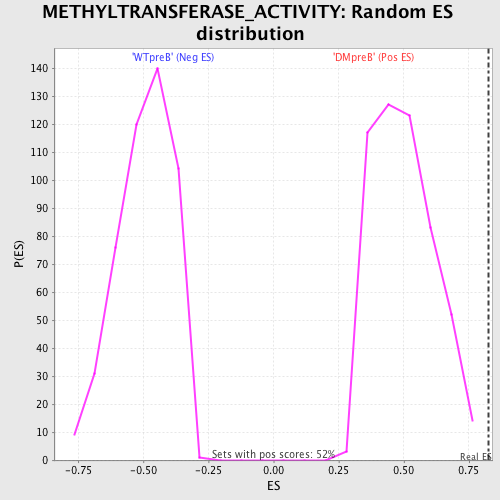
| GeneSet | METHYLTRANSFERASE_ACTIVITY |
| Enrichment Score (ES) | 0.8233002 |
| Normalized Enrichment Score (NES) | 1.652674 |
| Nominal p-value | 0.0 |
| FDR q-value | 0.014623724 |
| FWER p-Value | 0.218 |
| PROBE | DESCRIPTION (from dataset) | GENE SYMBOL | GENE_TITLE | RANK IN GENE LIST | RANK METRIC SCORE | RUNNING ES | CORE ENRICHMENT | |
|---|---|---|---|---|---|---|---|---|
| 1 | ATIC | 14231 3968 | 53 | 9.237 | 0.1476 | Yes | ||
| 2 | GART | 22543 1754 | 159 | 7.447 | 0.2632 | Yes | ||
| 3 | PRMT5 | 6571 2817 | 304 | 6.184 | 0.3561 | Yes | ||
| 4 | PRMT1 | 9121 | 309 | 6.175 | 0.4564 | Yes | ||
| 5 | CARM1 | 19539 | 422 | 5.402 | 0.5384 | Yes | ||
| 6 | NSUN2 | 21610 | 447 | 5.321 | 0.6237 | Yes | ||
| 7 | DNMT1 | 19217 | 456 | 5.277 | 0.7092 | Yes | ||
| 8 | SUV39H1 | 24194 | 1202 | 2.857 | 0.7157 | Yes | ||
| 9 | EED | 17759 | 1687 | 1.998 | 0.7221 | Yes | ||
| 10 | RNMT | 7501 | 1694 | 1.984 | 0.7541 | Yes | ||
| 11 | TPMT | 10213 | 1740 | 1.899 | 0.7826 | Yes | ||
| 12 | PEMT | 20423 | 1865 | 1.731 | 0.8042 | Yes | ||
| 13 | DNMT3B | 2840 14785 | 1986 | 1.573 | 0.8233 | Yes | ||
| 14 | TRDMT1 | 2713 2915 14681 | 3755 | 0.260 | 0.7324 | No | ||
| 15 | AS3MT | 23832 12185 | 6420 | 0.055 | 0.5900 | No | ||
| 16 | NNMT | 19131 | 6552 | 0.052 | 0.5838 | No | ||
| 17 | COQ3 | 16262 | 7136 | 0.040 | 0.5531 | No | ||
| 18 | SUV39H2 | 7232 12263 | 7211 | 0.038 | 0.5497 | No | ||
| 19 | BHMT | 4446 | 8266 | 0.021 | 0.4933 | No | ||
| 20 | GAMT | 19698 | 9070 | 0.011 | 0.4503 | No | ||
| 21 | MGMT | 9386 5096 | 10019 | -0.001 | 0.3993 | No | ||
| 22 | EZH2 | 1092 17163 | 11493 | -0.021 | 0.3204 | No | ||
| 23 | METTL1 | 19860 3400 3404 | 11715 | -0.025 | 0.3089 | No | ||
| 24 | DNMT3A | 2167 21330 | 12095 | -0.032 | 0.2891 | No | ||
| 25 | PNMT | 20677 | 12854 | -0.050 | 0.2491 | No | ||
| 26 | NSD1 | 2134 5197 | 14393 | -0.140 | 0.1686 | No | ||
| 27 | PCMT1 | 5230 3361 | 14499 | -0.151 | 0.1655 | No | ||
| 28 | LCMT1 | 18088 1094 | 15567 | -0.428 | 0.1150 | No | ||
| 29 | EHMT1 | 13401 14670 2756 8090 | 16292 | -1.001 | 0.0924 | No | ||
| 30 | EDF1 | 2890 12224 | 17068 | -2.003 | 0.0833 | No |