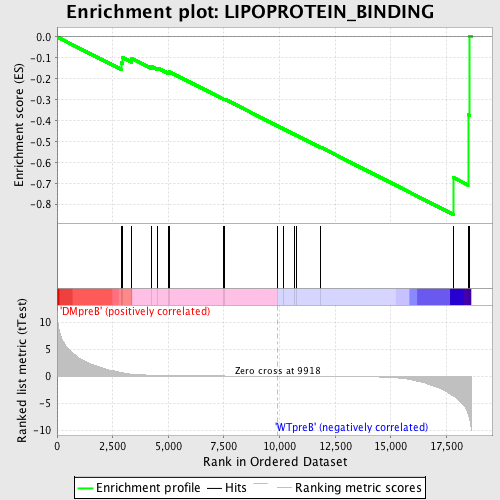
Profile of the Running ES Score & Positions of GeneSet Members on the Rank Ordered List
| Dataset | Set_04_DMpreB_versus_WTpreB.phenotype_DMpreB_versus_WTpreB.cls #DMpreB_versus_WTpreB |
| Phenotype | phenotype_DMpreB_versus_WTpreB.cls#DMpreB_versus_WTpreB |
| Upregulated in class | WTpreB |
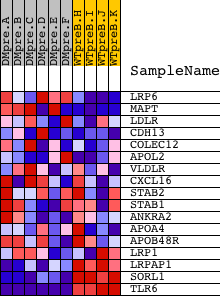
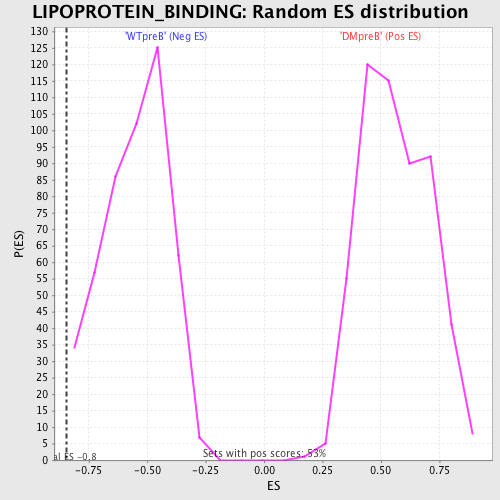
| GeneSet | LIPOPROTEIN_BINDING |
| Enrichment Score (ES) | -0.8466673 |
| Normalized Enrichment Score (NES) | -1.5393254 |
| Nominal p-value | 0.0042283298 |
| FDR q-value | 0.28327525 |
| FWER p-Value | 0.976 |
| PROBE | DESCRIPTION (from dataset) | GENE SYMBOL | GENE_TITLE | RANK IN GENE LIST | RANK METRIC SCORE | RUNNING ES | CORE ENRICHMENT | |
|---|---|---|---|---|---|---|---|---|
| 1 | LRP6 | 9286 | 2877 | 0.656 | -0.1231 | No | ||
| 2 | MAPT | 9420 1347 | 2946 | 0.604 | -0.0977 | No | ||
| 3 | LDLR | 4990 | 3359 | 0.366 | -0.1023 | No | ||
| 4 | CDH13 | 4506 3826 | 4231 | 0.181 | -0.1404 | No | ||
| 5 | COLEC12 | 23624 8946 | 4530 | 0.147 | -0.1493 | No | ||
| 6 | APOL2 | 22229 | 4998 | 0.112 | -0.1690 | No | ||
| 7 | VLDLR | 5858 3763 912 3682 | 5044 | 0.110 | -0.1661 | No | ||
| 8 | CXCL16 | 7251 | 7494 | 0.033 | -0.2962 | No | ||
| 9 | STAB2 | 19656 | 7535 | 0.032 | -0.2968 | No | ||
| 10 | STAB1 | 21892 | 9894 | 0.000 | -0.4236 | No | ||
| 11 | ANKRA2 | 21578 | 10163 | -0.003 | -0.4379 | No | ||
| 12 | APOA4 | 4401 | 10647 | -0.009 | -0.4634 | No | ||
| 13 | APOB48R | 18081 | 10750 | -0.011 | -0.4684 | No | ||
| 14 | LRP1 | 9284 | 11848 | -0.027 | -0.5260 | No | ||
| 15 | LRPAP1 | 5005 | 17813 | -3.652 | -0.6710 | Yes | ||
| 16 | SORL1 | 5474 | 18470 | -6.990 | -0.3700 | Yes | ||
| 17 | TLR6 | 215 16528 | 18539 | -7.853 | 0.0041 | Yes |