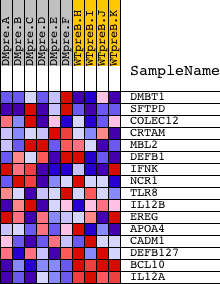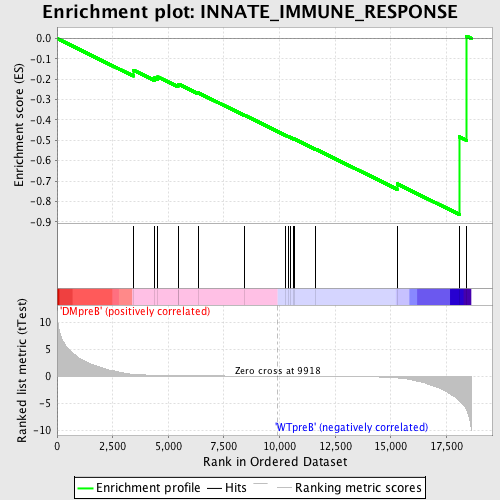
Profile of the Running ES Score & Positions of GeneSet Members on the Rank Ordered List
| Dataset | Set_04_DMpreB_versus_WTpreB.phenotype_DMpreB_versus_WTpreB.cls #DMpreB_versus_WTpreB |
| Phenotype | phenotype_DMpreB_versus_WTpreB.cls#DMpreB_versus_WTpreB |
| Upregulated in class | WTpreB |
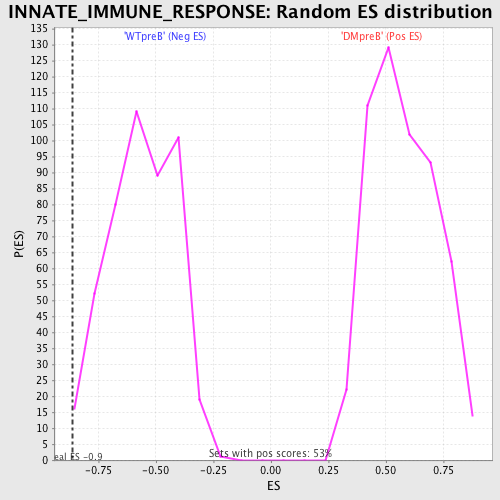
| GeneSet | INNATE_IMMUNE_RESPONSE |
| Enrichment Score (ES) | -0.8643162 |
| Normalized Enrichment Score (NES) | -1.5381782 |
| Nominal p-value | 0.014989293 |
| FDR q-value | 0.27007577 |
| FWER p-Value | 0.977 |
| PROBE | DESCRIPTION (from dataset) | GENE SYMBOL | GENE_TITLE | RANK IN GENE LIST | RANK METRIC SCORE | RUNNING ES | CORE ENRICHMENT | |
|---|---|---|---|---|---|---|---|---|
| 1 | DMBT1 | 18050 | 3424 | 0.347 | -0.1551 | No | ||
| 2 | SFTPD | 21867 | 4388 | 0.161 | -0.1934 | No | ||
| 3 | COLEC12 | 23624 8946 | 4530 | 0.147 | -0.1886 | No | ||
| 4 | CRTAM | 19160 | 5436 | 0.089 | -0.2299 | No | ||
| 5 | MBL2 | 23886 | 5465 | 0.088 | -0.2240 | No | ||
| 6 | DEFB1 | 18663 | 6346 | 0.057 | -0.2666 | No | ||
| 7 | IFNK | 11837 | 8442 | 0.019 | -0.3777 | No | ||
| 8 | NCR1 | 18409 | 10246 | -0.004 | -0.4743 | No | ||
| 9 | TLR8 | 9308 | 10380 | -0.006 | -0.4810 | No | ||
| 10 | IL12B | 20918 | 10475 | -0.007 | -0.4855 | No | ||
| 11 | EREG | 4679 16797 | 10638 | -0.009 | -0.4934 | No | ||
| 12 | APOA4 | 4401 | 10647 | -0.009 | -0.4931 | No | ||
| 13 | CADM1 | 7057 | 11628 | -0.024 | -0.5438 | No | ||
| 14 | DEFB127 | 622 | 15284 | -0.315 | -0.7140 | Yes | ||
| 15 | BCL10 | 15397 | 18081 | -4.569 | -0.4825 | Yes | ||
| 16 | IL12A | 4913 | 18393 | -6.118 | 0.0120 | Yes |