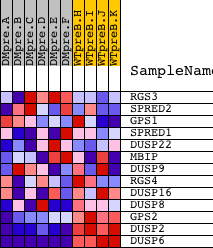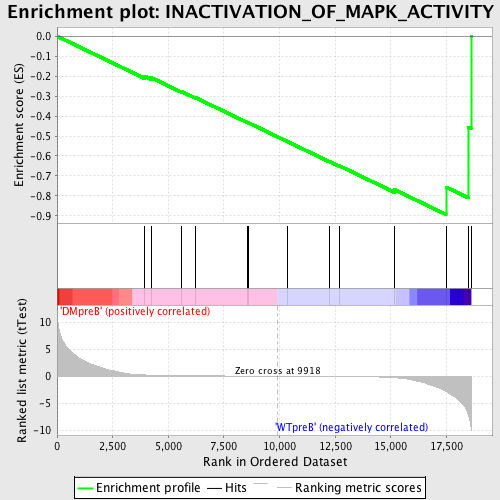
Profile of the Running ES Score & Positions of GeneSet Members on the Rank Ordered List
| Dataset | Set_04_DMpreB_versus_WTpreB.phenotype_DMpreB_versus_WTpreB.cls #DMpreB_versus_WTpreB |
| Phenotype | phenotype_DMpreB_versus_WTpreB.cls#DMpreB_versus_WTpreB |
| Upregulated in class | WTpreB |
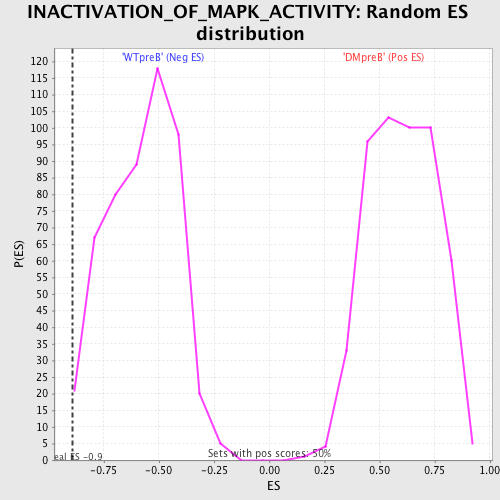
| GeneSet | INACTIVATION_OF_MAPK_ACTIVITY |
| Enrichment Score (ES) | -0.8931995 |
| Normalized Enrichment Score (NES) | -1.5419317 |
| Nominal p-value | 0.006024096 |
| FDR q-value | 0.31585962 |
| FWER p-Value | 0.972 |
| PROBE | DESCRIPTION (from dataset) | GENE SYMBOL | GENE_TITLE | RANK IN GENE LIST | RANK METRIC SCORE | RUNNING ES | CORE ENRICHMENT | |
|---|---|---|---|---|---|---|---|---|
| 1 | RGS3 | 2434 2474 6937 11935 2374 2332 2445 2390 | 3930 | 0.226 | -0.2003 | No | ||
| 2 | SPRED2 | 8539 4332 | 4238 | 0.180 | -0.2081 | No | ||
| 3 | GPS1 | 1392 9943 5550 9944 | 5598 | 0.082 | -0.2771 | No | ||
| 4 | SPRED1 | 4331 | 6232 | 0.060 | -0.3083 | No | ||
| 5 | DUSP22 | 466 21680 | 8571 | 0.017 | -0.4331 | No | ||
| 6 | MBIP | 21063 2072 | 8582 | 0.017 | -0.4329 | No | ||
| 7 | DUSP9 | 24307 | 10373 | -0.005 | -0.5288 | No | ||
| 8 | RGS4 | 9724 | 12233 | -0.035 | -0.6270 | No | ||
| 9 | DUSP16 | 1004 7699 | 12674 | -0.046 | -0.6485 | No | ||
| 10 | DUSP8 | 9493 | 15165 | -0.280 | -0.7687 | Yes | ||
| 11 | GPS2 | 12096 | 17482 | -2.830 | -0.7559 | Yes | ||
| 12 | DUSP2 | 14865 | 18496 | -7.254 | -0.4584 | Yes | ||
| 13 | DUSP6 | 19891 3399 | 18608 | -9.583 | 0.0004 | Yes |