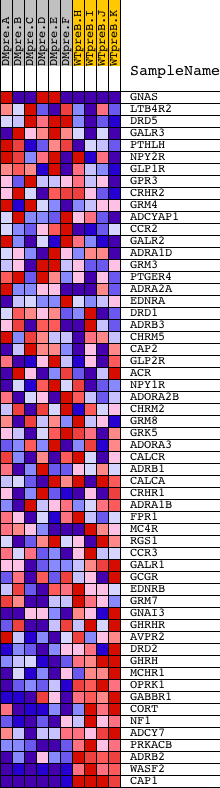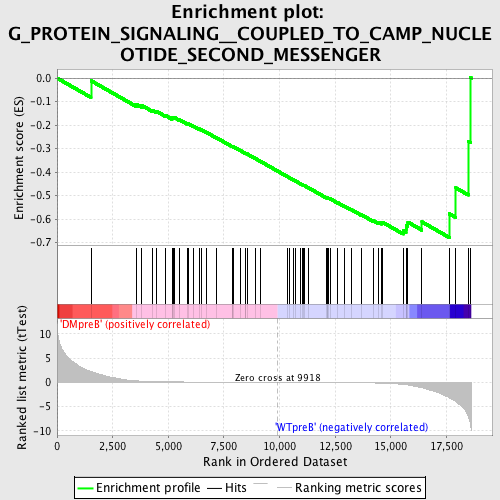
Profile of the Running ES Score & Positions of GeneSet Members on the Rank Ordered List
| Dataset | Set_04_DMpreB_versus_WTpreB.phenotype_DMpreB_versus_WTpreB.cls #DMpreB_versus_WTpreB |
| Phenotype | phenotype_DMpreB_versus_WTpreB.cls#DMpreB_versus_WTpreB |
| Upregulated in class | WTpreB |
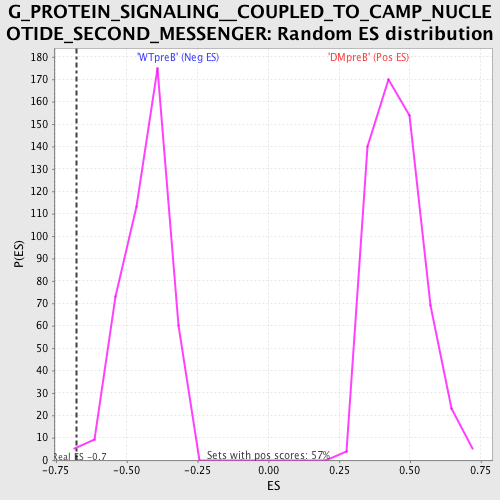
| GeneSet | G_PROTEIN_SIGNALING__COUPLED_TO_CAMP_NUCLEOTIDE_SECOND_MESSENGER |
| Enrichment Score (ES) | -0.6777561 |
| Normalized Enrichment Score (NES) | -1.5704436 |
| Nominal p-value | 0.0022988506 |
| FDR q-value | 0.31372455 |
| FWER p-Value | 0.888 |
| PROBE | DESCRIPTION (from dataset) | GENE SYMBOL | GENE_TITLE | RANK IN GENE LIST | RANK METRIC SCORE | RUNNING ES | CORE ENRICHMENT | |
|---|---|---|---|---|---|---|---|---|
| 1 | GNAS | 9025 2963 2752 | 1524 | 2.229 | -0.0111 | No | ||
| 2 | LTB4R2 | 7163 | 3571 | 0.308 | -0.1115 | No | ||
| 3 | DRD5 | 16853 | 3801 | 0.251 | -0.1159 | No | ||
| 4 | GALR3 | 9000 | 4289 | 0.174 | -0.1366 | No | ||
| 5 | PTHLH | 16931 | 4462 | 0.154 | -0.1409 | No | ||
| 6 | NPY2R | 343 | 4893 | 0.119 | -0.1603 | No | ||
| 7 | GLP1R | 23304 | 5165 | 0.103 | -0.1716 | No | ||
| 8 | GPR3 | 15729 | 5176 | 0.103 | -0.1689 | No | ||
| 9 | CRHR2 | 17140 | 5244 | 0.099 | -0.1693 | No | ||
| 10 | GRM4 | 332 | 5282 | 0.097 | -0.1682 | No | ||
| 11 | ADCYAP1 | 4348 | 5497 | 0.086 | -0.1770 | No | ||
| 12 | CCR2 | 19250 | 5881 | 0.070 | -0.1954 | No | ||
| 13 | GALR2 | 20587 | 5892 | 0.070 | -0.1937 | No | ||
| 14 | ADRA1D | 20737 8561 | 6115 | 0.063 | -0.2037 | No | ||
| 15 | GRM3 | 16929 | 6379 | 0.056 | -0.2161 | No | ||
| 16 | PTGER4 | 9649 | 6467 | 0.054 | -0.2191 | No | ||
| 17 | ADRA2A | 4355 | 6721 | 0.048 | -0.2311 | No | ||
| 18 | EDNRA | 18834 | 7164 | 0.039 | -0.2537 | No | ||
| 19 | DRD1 | 4638 | 7875 | 0.027 | -0.2911 | No | ||
| 20 | ADRB3 | 18901 | 7882 | 0.027 | -0.2906 | No | ||
| 21 | CHRM5 | 10038 | 7936 | 0.026 | -0.2926 | No | ||
| 22 | CAP2 | 21649 | 8238 | 0.021 | -0.3082 | No | ||
| 23 | GLP2R | 8227 13563 13564 | 8447 | 0.018 | -0.3188 | No | ||
| 24 | ACR | 22384 8529 | 8461 | 0.018 | -0.3189 | No | ||
| 25 | NPY1R | 9482 | 8536 | 0.017 | -0.3223 | No | ||
| 26 | ADORA2B | 20850 | 8922 | 0.013 | -0.3427 | No | ||
| 27 | CHRM2 | 10840 | 9128 | 0.010 | -0.3534 | No | ||
| 28 | GRM8 | 4805 | 10356 | -0.005 | -0.4194 | No | ||
| 29 | GRK5 | 9036 23814 | 10447 | -0.006 | -0.4240 | No | ||
| 30 | ADORA3 | 4352 | 10635 | -0.009 | -0.4338 | No | ||
| 31 | CALCR | 17229 | 10722 | -0.010 | -0.4381 | No | ||
| 32 | ADRB1 | 4357 | 10954 | -0.013 | -0.4501 | No | ||
| 33 | CALCA | 4470 | 11037 | -0.014 | -0.4541 | No | ||
| 34 | CRHR1 | 1464 1468 20633 | 11071 | -0.015 | -0.4554 | No | ||
| 35 | ADRA1B | 4354 | 11120 | -0.016 | -0.4574 | No | ||
| 36 | FPR1 | 23115 | 11300 | -0.019 | -0.4665 | No | ||
| 37 | MC4R | 13701 | 12098 | -0.032 | -0.5084 | No | ||
| 38 | RGS1 | 3970 6936 | 12136 | -0.033 | -0.5094 | No | ||
| 39 | CCR3 | 19251 | 12158 | -0.033 | -0.5094 | No | ||
| 40 | GALR1 | 23397 | 12219 | -0.034 | -0.5116 | No | ||
| 41 | GCGR | 20566 | 12267 | -0.036 | -0.5130 | No | ||
| 42 | EDNRB | 21728 3564 | 12617 | -0.045 | -0.5304 | No | ||
| 43 | GRM7 | 17338 | 12929 | -0.052 | -0.5454 | No | ||
| 44 | GNAI3 | 15198 | 13219 | -0.062 | -0.5590 | No | ||
| 45 | GHRHR | 1007 17436 | 13660 | -0.081 | -0.5802 | No | ||
| 46 | AVPR2 | 8646 | 14223 | -0.121 | -0.6066 | No | ||
| 47 | DRD2 | 19461 | 14432 | -0.145 | -0.6132 | No | ||
| 48 | GHRH | 14372 | 14572 | -0.160 | -0.6156 | No | ||
| 49 | MCHR1 | 22416 | 14633 | -0.171 | -0.6134 | No | ||
| 50 | OPRK1 | 14300 | 15557 | -0.425 | -0.6495 | Yes | ||
| 51 | GABBR1 | 1519 7034 | 15684 | -0.481 | -0.6410 | Yes | ||
| 52 | CORT | 15669 2539 | 15707 | -0.497 | -0.6263 | Yes | ||
| 53 | NF1 | 5165 | 15767 | -0.530 | -0.6126 | Yes | ||
| 54 | ADCY7 | 8552 448 | 16398 | -1.096 | -0.6116 | Yes | ||
| 55 | PRKACB | 15140 | 17626 | -3.163 | -0.5770 | Yes | ||
| 56 | ADRB2 | 23422 | 17922 | -3.954 | -0.4669 | Yes | ||
| 57 | WASF2 | 6326 | 18486 | -7.185 | -0.2684 | Yes | ||
| 58 | CAP1 | 8684 | 18574 | -8.642 | 0.0023 | Yes |