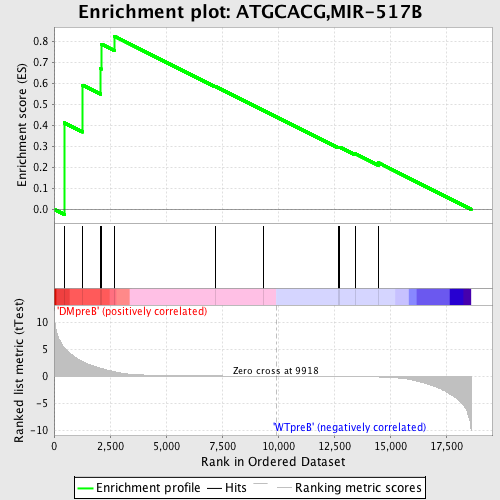
Profile of the Running ES Score & Positions of GeneSet Members on the Rank Ordered List
| Dataset | Set_04_DMpreB_versus_WTpreB.phenotype_DMpreB_versus_WTpreB.cls #DMpreB_versus_WTpreB |
| Phenotype | phenotype_DMpreB_versus_WTpreB.cls#DMpreB_versus_WTpreB |
| Upregulated in class | DMpreB |
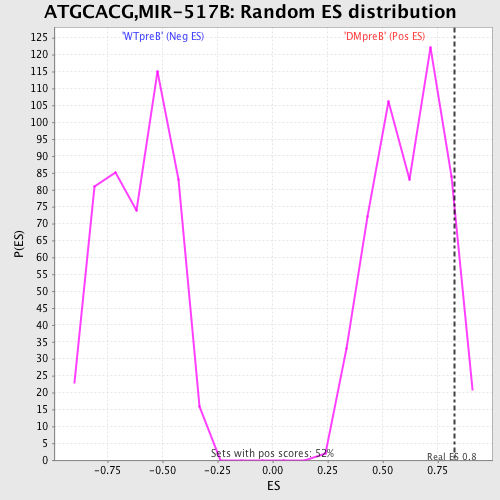
| GeneSet | ATGCACG,MIR-517B |
| Enrichment Score (ES) | 0.8262925 |
| Normalized Enrichment Score (NES) | 1.3375491 |
| Nominal p-value | 0.05927342 |
| FDR q-value | 0.3083251 |
| FWER p-Value | 1.0 |
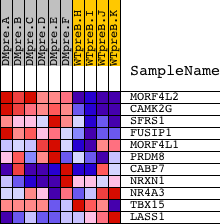
| PROBE | DESCRIPTION (from dataset) | GENE SYMBOL | GENE_TITLE | RANK IN GENE LIST | RANK METRIC SCORE | RUNNING ES | CORE ENRICHMENT | |
|---|---|---|---|---|---|---|---|---|
| 1 | MORF4L2 | 12118 | 457 | 5.277 | 0.4124 | Yes | ||
| 2 | CAMK2G | 21905 | 1270 | 2.700 | 0.5923 | Yes | ||
| 3 | SFRS1 | 8492 | 2072 | 1.466 | 0.6707 | Yes | ||
| 4 | FUSIP1 | 4715 16036 | 2100 | 1.442 | 0.7886 | Yes | ||
| 5 | MORF4L1 | 5723 | 2684 | 0.833 | 0.8263 | Yes | ||
| 6 | PRDM8 | 8084 | 7184 | 0.039 | 0.5877 | No | ||
| 7 | CABP7 | 20542 | 9356 | 0.007 | 0.4716 | No | ||
| 8 | NRXN1 | 1581 1575 22875 | 12682 | -0.046 | 0.2967 | No | ||
| 9 | NR4A3 | 9473 16212 5183 | 12758 | -0.048 | 0.2966 | No | ||
| 10 | TBX15 | 5632 10040 | 13434 | -0.070 | 0.2662 | No | ||
| 11 | LASS1 | 3911 13566 | 14469 | -0.149 | 0.2229 | No |