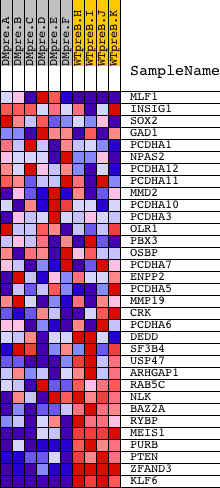
Profile of the Running ES Score & Positions of GeneSet Members on the Rank Ordered List
| Dataset | Set_04_DMpreB_versus_WTpreB.phenotype_DMpreB_versus_WTpreB.cls #DMpreB_versus_WTpreB |
| Phenotype | phenotype_DMpreB_versus_WTpreB.cls#DMpreB_versus_WTpreB |
| Upregulated in class | WTpreB |
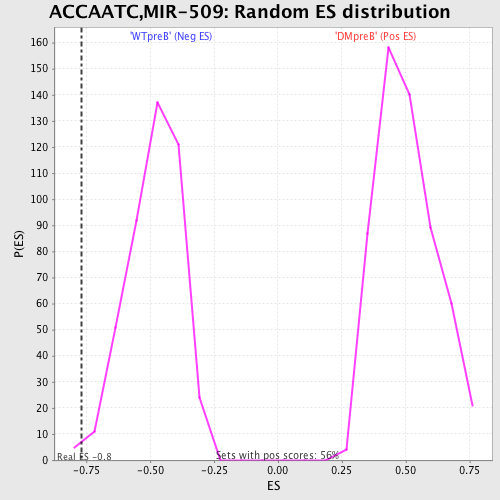
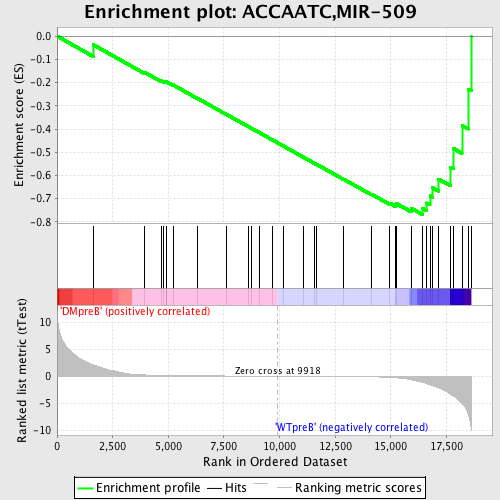
| GeneSet | ACCAATC,MIR-509 |
| Enrichment Score (ES) | -0.7680073 |
| Normalized Enrichment Score (NES) | -1.5903146 |
| Nominal p-value | 0.009070295 |
| FDR q-value | 0.0498453 |
| FWER p-Value | 0.333 |
| PROBE | DESCRIPTION (from dataset) | GENE SYMBOL | GENE_TITLE | RANK IN GENE LIST | RANK METRIC SCORE | RUNNING ES | CORE ENRICHMENT | |
|---|---|---|---|---|---|---|---|---|
| 1 | MLF1 | 15573 | 1620 | 2.098 | -0.0368 | No | ||
| 2 | INSIG1 | 6073 10525 10526 | 3914 | 0.229 | -0.1547 | No | ||
| 3 | SOX2 | 9849 15612 | 4683 | 0.134 | -0.1928 | No | ||
| 4 | GAD1 | 14993 2690 | 4799 | 0.125 | -0.1960 | No | ||
| 5 | PCDHA1 | 8571 4368 | 4900 | 0.118 | -0.1986 | No | ||
| 6 | NPAS2 | 5186 | 4919 | 0.117 | -0.1967 | No | ||
| 7 | PCDHA12 | 9645 | 5211 | 0.101 | -0.2100 | No | ||
| 8 | PCDHA11 | 8791 | 6301 | 0.058 | -0.2672 | No | ||
| 9 | MMD2 | 16309 | 7619 | 0.031 | -0.3373 | No | ||
| 10 | PCDHA10 | 8792 | 8611 | 0.016 | -0.3903 | No | ||
| 11 | PCDHA3 | 9644 | 8719 | 0.015 | -0.3957 | No | ||
| 12 | OLR1 | 8427 4233 | 9098 | 0.011 | -0.4157 | No | ||
| 13 | PBX3 | 9531 2714 2705 | 9698 | 0.003 | -0.4479 | No | ||
| 14 | OSBP | 4278 | 10165 | -0.003 | -0.4729 | No | ||
| 15 | PCDHA7 | 8789 | 11054 | -0.015 | -0.5203 | No | ||
| 16 | ENPP2 | 9548 | 11567 | -0.023 | -0.5474 | No | ||
| 17 | PCDHA5 | 8790 | 11674 | -0.024 | -0.5525 | No | ||
| 18 | MMP19 | 7191 | 12888 | -0.051 | -0.6165 | No | ||
| 19 | CRK | 4559 1249 | 14137 | -0.112 | -0.6810 | No | ||
| 20 | PCDHA6 | 2038 8788 | 14944 | -0.226 | -0.7189 | No | ||
| 21 | DEDD | 14056 | 15224 | -0.295 | -0.7269 | No | ||
| 22 | SF3B4 | 22269 | 15268 | -0.309 | -0.7218 | No | ||
| 23 | USP47 | 6794 | 15911 | -0.645 | -0.7408 | No | ||
| 24 | ARHGAP1 | 6001 10448 | 16417 | -1.121 | -0.7411 | Yes | ||
| 25 | RAB5C | 20226 | 16610 | -1.373 | -0.7185 | Yes | ||
| 26 | NLK | 5179 5178 | 16761 | -1.599 | -0.6882 | Yes | ||
| 27 | BAZ2A | 4371 | 16873 | -1.734 | -0.6526 | Yes | ||
| 28 | RYBP | 17056 | 17143 | -2.143 | -0.6157 | Yes | ||
| 29 | MEIS1 | 20524 | 17695 | -3.354 | -0.5648 | Yes | ||
| 30 | PURB | 5335 | 17809 | -3.641 | -0.4835 | Yes | ||
| 31 | PTEN | 5305 | 18200 | -4.996 | -0.3847 | Yes | ||
| 32 | ZFAND3 | 23306 | 18484 | -7.171 | -0.2278 | Yes | ||
| 33 | KLF6 | 10713 21711 | 18613 | -9.790 | 0.0002 | Yes |