Profile of the Running ES Score & Positions of GeneSet Members on the Rank Ordered List
| Dataset | Set_04_DMpreB_versus_WTpreB.phenotype_DMpreB_versus_WTpreB.cls #DMpreB_versus_WTpreB |
| Phenotype | phenotype_DMpreB_versus_WTpreB.cls#DMpreB_versus_WTpreB |
| Upregulated in class | DMpreB |
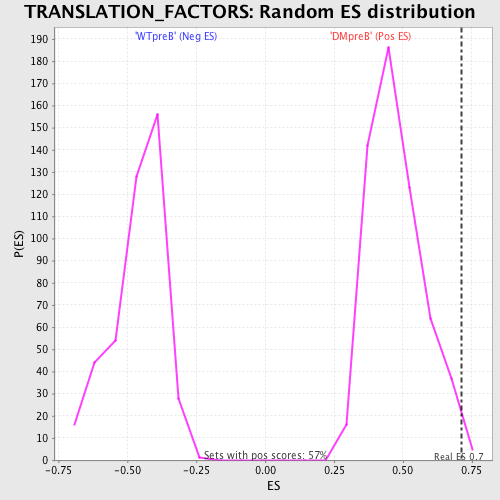
| GeneSet | TRANSLATION_FACTORS |
| Enrichment Score (ES) | 0.71279836 |
| Normalized Enrichment Score (NES) | 1.5013338 |
| Nominal p-value | 0.008726004 |
| FDR q-value | 0.14807098 |
| FWER p-Value | 0.958 |
| PROBE | DESCRIPTION (from dataset) | GENE SYMBOL | GENE_TITLE | RANK IN GENE LIST | RANK METRIC SCORE | RUNNING ES | CORE ENRICHMENT | |
|---|---|---|---|---|---|---|---|---|
| 1 | EIF2B3 | 16118 | 64 | 9.018 | 0.0772 | Yes | ||
| 2 | EIF4A1 | 8889 23719 | 80 | 8.676 | 0.1540 | Yes | ||
| 3 | EIF5A | 11345 20379 6590 | 188 | 7.145 | 0.2122 | Yes | ||
| 4 | ETF1 | 23467 | 265 | 6.495 | 0.2662 | Yes | ||
| 5 | EIF3S2 | 15744 2342 2478 | 266 | 6.494 | 0.3243 | Yes | ||
| 6 | EIF2B1 | 16368 3458 | 368 | 5.739 | 0.3702 | Yes | ||
| 7 | EEF1B2 | 4131 12063 | 543 | 4.868 | 0.4044 | Yes | ||
| 8 | EEF1G | 12480 | 547 | 4.848 | 0.4476 | Yes | ||
| 9 | EIF4G1 | 22818 | 582 | 4.708 | 0.4879 | Yes | ||
| 10 | EIF2AK2 | 22892 | 839 | 3.843 | 0.5085 | Yes | ||
| 11 | EIF3S8 | 7099 12100 | 912 | 3.603 | 0.5369 | Yes | ||
| 12 | ITGB4BP | 9191 | 918 | 3.576 | 0.5686 | Yes | ||
| 13 | EIF3S7 | 22226 | 975 | 3.397 | 0.5960 | Yes | ||
| 14 | EIF3S6 | 4924 | 1199 | 2.864 | 0.6096 | Yes | ||
| 15 | EIF3S10 | 4659 8887 | 1525 | 2.229 | 0.6120 | Yes | ||
| 16 | EIF3S9 | 16643 3528 | 1565 | 2.172 | 0.6293 | Yes | ||
| 17 | EIF5 | 5736 | 1642 | 2.062 | 0.6437 | Yes | ||
| 18 | EIF2B4 | 16574 | 1706 | 1.959 | 0.6578 | Yes | ||
| 19 | EIF2S2 | 7406 14383 | 1803 | 1.829 | 0.6690 | Yes | ||
| 20 | SLC35A4 | 12588 | 1811 | 1.812 | 0.6849 | Yes | ||
| 21 | EIF1AY | 2643 24219 | 1966 | 1.582 | 0.6907 | Yes | ||
| 22 | PABPC1 | 5219 9522 9523 23572 | 1969 | 1.581 | 0.7048 | Yes | ||
| 23 | EIF2B5 | 1719 22822 | 2065 | 1.470 | 0.7128 | Yes | ||
| 24 | EIF3S3 | 12652 | 2529 | 0.987 | 0.6967 | No | ||
| 25 | EIF2B2 | 21204 | 2693 | 0.823 | 0.6953 | No | ||
| 26 | EEF2 | 8881 4654 8882 | 3263 | 0.412 | 0.6683 | No | ||
| 27 | EEF1A2 | 8880 14309 | 4328 | 0.169 | 0.6126 | No | ||
| 28 | PAIP1 | 21556 | 4492 | 0.151 | 0.6051 | No | ||
| 29 | EIF2S1 | 4658 | 4969 | 0.114 | 0.5805 | No | ||
| 30 | EIF3S1 | 905 8114 | 6441 | 0.054 | 0.5018 | No | ||
| 31 | GSPT2 | 4806 | 7478 | 0.033 | 0.4464 | No | ||
| 32 | EIF4E | 15403 1827 8890 | 7583 | 0.031 | 0.4410 | No | ||
| 33 | EIF5B | 10391 5963 | 12946 | -0.053 | 0.1528 | No | ||
| 34 | EEF2K | 18101 | 14842 | -0.208 | 0.0527 | No | ||
| 35 | EIF2AK1 | 4869 | 15350 | -0.334 | 0.0284 | No | ||
| 36 | EIF4EBP1 | 8891 4661 | 15963 | -0.688 | 0.0016 | No | ||
| 37 | EIF3S5 | 18131 | 15988 | -0.706 | 0.0066 | No | ||
| 38 | EIF4A2 | 4660 1679 1645 | 16290 | -1.000 | -0.0007 | No | ||
| 39 | EIF3S4 | 6588 11988 | 16782 | -1.630 | -0.0125 | No | ||
| 40 | EEF1D | 12393 2309 | 17136 | -2.131 | -0.0125 | No | ||
| 41 | EIF4EBP2 | 4662 | 17529 | -2.928 | -0.0074 | No | ||
| 42 | EIF2AK3 | 17421 | 17710 | -3.390 | 0.0132 | No | ||
| 43 | EIF4G3 | 10517 | 17925 | -3.966 | 0.0372 | No |