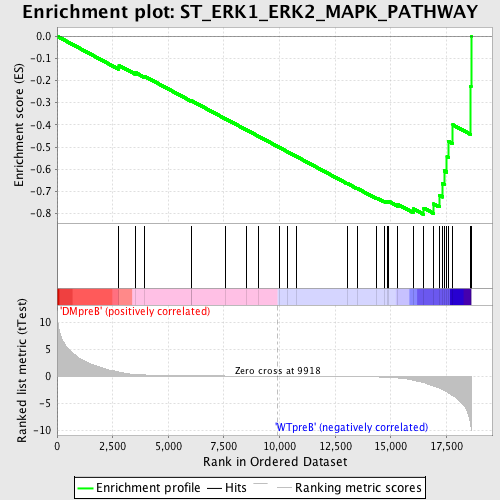
Profile of the Running ES Score & Positions of GeneSet Members on the Rank Ordered List
| Dataset | Set_04_DMpreB_versus_WTpreB.phenotype_DMpreB_versus_WTpreB.cls #DMpreB_versus_WTpreB |
| Phenotype | phenotype_DMpreB_versus_WTpreB.cls#DMpreB_versus_WTpreB |
| Upregulated in class | WTpreB |
| GeneSet | ST_ERK1_ERK2_MAPK_PATHWAY |
| Enrichment Score (ES) | -0.8041579 |
| Normalized Enrichment Score (NES) | -1.6251469 |
| Nominal p-value | 0.0 |
| FDR q-value | 0.02929165 |
| FWER p-Value | 0.326 |
| PROBE | DESCRIPTION (from dataset) | GENE SYMBOL | GENE_TITLE | RANK IN GENE LIST | RANK METRIC SCORE | RUNNING ES | CORE ENRICHMENT | |
|---|---|---|---|---|---|---|---|---|
| 1 | TRAF3 | 21147 | 2780 | 0.741 | -0.1319 | No | ||
| 2 | MKNK2 | 3299 9392 | 3518 | 0.322 | -0.1639 | No | ||
| 3 | SHC1 | 9813 9812 5430 | 3936 | 0.225 | -0.1810 | No | ||
| 4 | RAP1A | 8467 | 6027 | 0.066 | -0.2919 | No | ||
| 5 | CREB5 | 10551 | 6052 | 0.065 | -0.2916 | No | ||
| 6 | EIF4E | 15403 1827 8890 | 7583 | 0.031 | -0.3732 | No | ||
| 7 | MOS | 16254 | 8494 | 0.018 | -0.4217 | No | ||
| 8 | HTATIP | 3690 | 9069 | 0.011 | -0.4524 | No | ||
| 9 | RPS6KA2 | 9759 9758 | 9999 | -0.001 | -0.5023 | No | ||
| 10 | DUSP9 | 24307 | 10373 | -0.005 | -0.5223 | No | ||
| 11 | RPS6KA1 | 15725 | 10766 | -0.011 | -0.5431 | No | ||
| 12 | SOS1 | 5476 | 13046 | -0.056 | -0.6644 | No | ||
| 13 | ATF1 | 8634 4417 | 13485 | -0.072 | -0.6862 | No | ||
| 14 | CREB1 | 3990 8782 4558 4093 | 14365 | -0.137 | -0.7302 | No | ||
| 15 | DUSP4 | 18632 3820 | 14695 | -0.182 | -0.7436 | No | ||
| 16 | EEF2K | 18101 | 14842 | -0.208 | -0.7465 | No | ||
| 17 | MAP2K2 | 19933 | 14908 | -0.221 | -0.7448 | No | ||
| 18 | MAP2K1 | 19082 | 15318 | -0.325 | -0.7590 | No | ||
| 19 | MAP3K8 | 23495 | 16016 | -0.736 | -0.7790 | Yes | ||
| 20 | RPS6KA3 | 8490 | 16484 | -1.198 | -0.7757 | Yes | ||
| 21 | MAPK3 | 6458 11170 | 16931 | -1.809 | -0.7566 | Yes | ||
| 22 | MKNK1 | 2504 | 17183 | -2.207 | -0.7176 | Yes | ||
| 23 | SOS2 | 21049 | 17328 | -2.499 | -0.6660 | Yes | ||
| 24 | CREB3 | 16231 | 17406 | -2.658 | -0.6069 | Yes | ||
| 25 | BAD | 24000 | 17524 | -2.914 | -0.5439 | Yes | ||
| 26 | GRB2 | 20149 | 17590 | -3.055 | -0.4748 | Yes | ||
| 27 | NFKB1 | 15160 | 17789 | -3.591 | -0.4000 | Yes | ||
| 28 | MAPK1 | 1642 11167 | 18592 | -9.104 | -0.2267 | Yes | ||
| 29 | DUSP6 | 19891 3399 | 18608 | -9.583 | 0.0004 | Yes |

