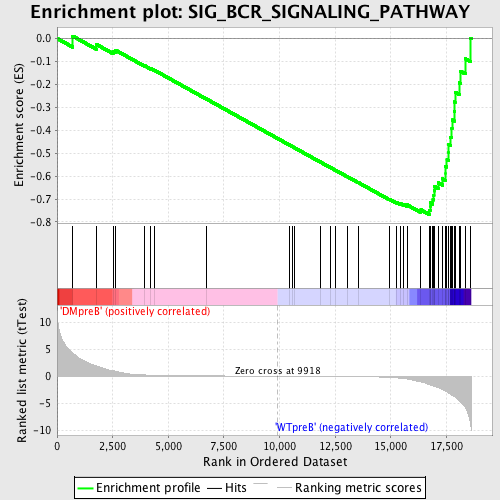
Profile of the Running ES Score & Positions of GeneSet Members on the Rank Ordered List
| Dataset | Set_04_DMpreB_versus_WTpreB.phenotype_DMpreB_versus_WTpreB.cls #DMpreB_versus_WTpreB |
| Phenotype | phenotype_DMpreB_versus_WTpreB.cls#DMpreB_versus_WTpreB |
| Upregulated in class | WTpreB |
| GeneSet | SIG_BCR_SIGNALING_PATHWAY |
| Enrichment Score (ES) | -0.76729584 |
| Normalized Enrichment Score (NES) | -1.6579318 |
| Nominal p-value | 0.0 |
| FDR q-value | 0.02688412 |
| FWER p-Value | 0.184 |
| PROBE | DESCRIPTION (from dataset) | GENE SYMBOL | GENE_TITLE | RANK IN GENE LIST | RANK METRIC SCORE | RUNNING ES | CORE ENRICHMENT | |
|---|---|---|---|---|---|---|---|---|
| 1 | PDK1 | 14987 | 702 | 4.264 | 0.0102 | No | ||
| 2 | BLNK | 23681 3691 | 1758 | 1.877 | -0.0255 | No | ||
| 3 | PPP3CA | 1863 5284 | 2520 | 0.993 | -0.0553 | No | ||
| 4 | FLOT2 | 1247 8975 1430 | 2631 | 0.889 | -0.0513 | No | ||
| 5 | SHC1 | 9813 9812 5430 | 3936 | 0.225 | -0.1189 | No | ||
| 6 | AKT1 | 8568 | 4218 | 0.183 | -0.1320 | No | ||
| 7 | BCL2 | 8651 3928 13864 4435 981 4062 13863 4027 | 4380 | 0.162 | -0.1389 | No | ||
| 8 | AKT2 | 4365 4366 | 6728 | 0.048 | -0.2647 | No | ||
| 9 | LYN | 16281 | 10463 | -0.007 | -0.4657 | No | ||
| 10 | CR2 | 3942 13707 | 10585 | -0.008 | -0.4721 | No | ||
| 11 | NR0B2 | 16050 | 10663 | -0.009 | -0.4761 | No | ||
| 12 | NFATC2 | 5168 2866 | 11816 | -0.027 | -0.5379 | No | ||
| 13 | PPP1R13B | 10211 20980 | 12274 | -0.036 | -0.5621 | No | ||
| 14 | PIK3R1 | 3170 | 12502 | -0.041 | -0.5738 | No | ||
| 15 | SOS1 | 5476 | 13046 | -0.056 | -0.6025 | No | ||
| 16 | PIK3CA | 9562 | 13540 | -0.075 | -0.6282 | No | ||
| 17 | GSK3A | 405 | 14926 | -0.223 | -0.7002 | No | ||
| 18 | BCR | 8478 3384 19990 | 15249 | -0.303 | -0.7142 | No | ||
| 19 | FLOT1 | 23249 1613 | 15420 | -0.360 | -0.7193 | No | ||
| 20 | PTPRC | 5327 9662 | 15564 | -0.428 | -0.7221 | No | ||
| 21 | ITPR2 | 9194 | 15731 | -0.509 | -0.7254 | No | ||
| 22 | DAG1 | 18996 8837 | 16354 | -1.044 | -0.7471 | No | ||
| 23 | PIK3CD | 9563 | 16730 | -1.548 | -0.7499 | Yes | ||
| 24 | AKT3 | 13739 982 | 16769 | -1.612 | -0.7338 | Yes | ||
| 25 | MAP4K1 | 18313 | 16775 | -1.624 | -0.7158 | Yes | ||
| 26 | ITPR3 | 9195 | 16893 | -1.758 | -0.7023 | Yes | ||
| 27 | MAPK3 | 6458 11170 | 16931 | -1.809 | -0.6839 | Yes | ||
| 28 | PPP3CB | 5285 | 16941 | -1.823 | -0.6639 | Yes | ||
| 29 | PPP3CC | 21763 | 16961 | -1.850 | -0.6441 | Yes | ||
| 30 | RAF1 | 17035 | 17131 | -2.125 | -0.6293 | Yes | ||
| 31 | SOS2 | 21049 | 17328 | -2.499 | -0.6118 | Yes | ||
| 32 | ITPR1 | 17341 | 17446 | -2.732 | -0.5873 | Yes | ||
| 33 | NFATC1 | 23398 1999 5167 9455 1985 1957 | 17449 | -2.738 | -0.5566 | Yes | ||
| 34 | BAD | 24000 | 17524 | -2.914 | -0.5278 | Yes | ||
| 35 | GRB2 | 20149 | 17590 | -3.055 | -0.4970 | Yes | ||
| 36 | GSK3B | 22761 | 17596 | -3.078 | -0.4626 | Yes | ||
| 37 | CD19 | 17640 | 17676 | -3.314 | -0.4296 | Yes | ||
| 38 | PLCG2 | 18453 | 17743 | -3.480 | -0.3940 | Yes | ||
| 39 | CD22 | 17881 | 17755 | -3.507 | -0.3551 | Yes | ||
| 40 | BTK | 24061 | 17851 | -3.733 | -0.3182 | Yes | ||
| 41 | CD81 | 8719 | 17871 | -3.794 | -0.2766 | Yes | ||
| 42 | INPP5D | 14198 | 17891 | -3.853 | -0.2343 | Yes | ||
| 43 | SYK | 21636 | 18074 | -4.548 | -0.1929 | Yes | ||
| 44 | VAV1 | 23173 | 18136 | -4.751 | -0.1427 | Yes | ||
| 45 | CSK | 8805 | 18359 | -5.871 | -0.0886 | Yes | ||
| 46 | MAPK1 | 1642 11167 | 18592 | -9.104 | 0.0013 | Yes |

