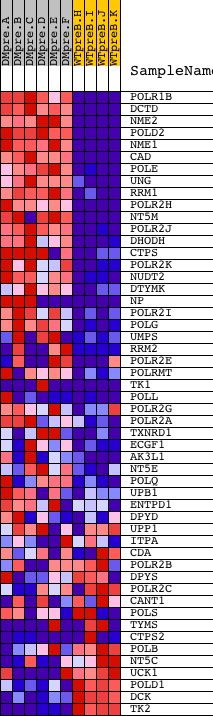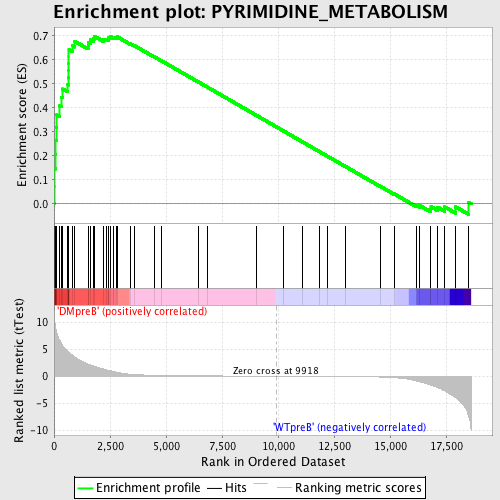
Profile of the Running ES Score & Positions of GeneSet Members on the Rank Ordered List
| Dataset | Set_04_DMpreB_versus_WTpreB.phenotype_DMpreB_versus_WTpreB.cls #DMpreB_versus_WTpreB |
| Phenotype | phenotype_DMpreB_versus_WTpreB.cls#DMpreB_versus_WTpreB |
| Upregulated in class | DMpreB |
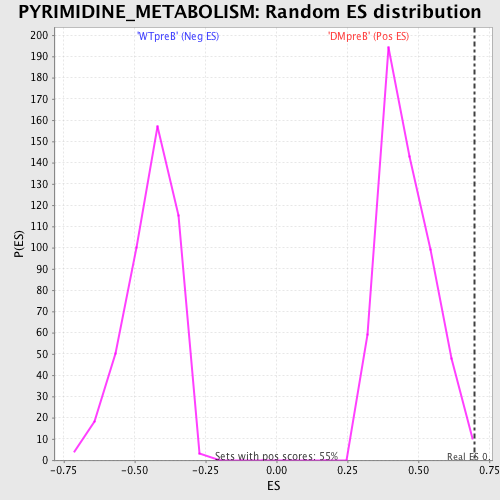
| GeneSet | PYRIMIDINE_METABOLISM |
| Enrichment Score (ES) | 0.69861686 |
| Normalized Enrichment Score (NES) | 1.5243565 |
| Nominal p-value | 0.0072332732 |
| FDR q-value | 0.13171132 |
| FWER p-Value | 0.882 |
| PROBE | DESCRIPTION (from dataset) | GENE SYMBOL | GENE_TITLE | RANK IN GENE LIST | RANK METRIC SCORE | RUNNING ES | CORE ENRICHMENT | |
|---|---|---|---|---|---|---|---|---|
| 1 | POLR1B | 14857 | 6 | 11.186 | 0.0740 | Yes | ||
| 2 | DCTD | 18620 | 8 | 11.065 | 0.1475 | Yes | ||
| 3 | NME2 | 9468 | 56 | 9.099 | 0.2054 | Yes | ||
| 4 | POLD2 | 20537 | 74 | 8.897 | 0.2636 | Yes | ||
| 5 | NME1 | 9467 | 97 | 8.436 | 0.3185 | Yes | ||
| 6 | CAD | 16886 | 121 | 7.983 | 0.3703 | Yes | ||
| 7 | POLE | 16755 | 244 | 6.625 | 0.4078 | Yes | ||
| 8 | UNG | 10257 16744 | 315 | 6.124 | 0.4447 | Yes | ||
| 9 | RRM1 | 18163 | 384 | 5.624 | 0.4784 | Yes | ||
| 10 | POLR2H | 10888 | 611 | 4.591 | 0.4968 | Yes | ||
| 11 | NT5M | 8345 4175 | 648 | 4.452 | 0.5244 | Yes | ||
| 12 | POLR2J | 16672 | 654 | 4.444 | 0.5537 | Yes | ||
| 13 | DHODH | 7152 | 658 | 4.437 | 0.5830 | Yes | ||
| 14 | CTPS | 2514 15772 | 662 | 4.414 | 0.6122 | Yes | ||
| 15 | POLR2K | 9413 | 663 | 4.410 | 0.6415 | Yes | ||
| 16 | NUDT2 | 16239 | 819 | 3.881 | 0.6589 | Yes | ||
| 17 | DTYMK | 5776 | 926 | 3.555 | 0.6769 | Yes | ||
| 18 | NP | 22027 9597 5273 5274 | 1516 | 2.233 | 0.6600 | Yes | ||
| 19 | POLR2I | 12839 | 1549 | 2.195 | 0.6728 | Yes | ||
| 20 | POLG | 17789 | 1626 | 2.089 | 0.6826 | Yes | ||
| 21 | UMPS | 22606 1760 | 1746 | 1.888 | 0.6888 | Yes | ||
| 22 | RRM2 | 5401 5400 | 1791 | 1.841 | 0.6986 | Yes | ||
| 23 | POLR2E | 3325 19699 | 2210 | 1.298 | 0.6847 | No | ||
| 24 | POLRMT | 19705 | 2321 | 1.152 | 0.6865 | No | ||
| 25 | TK1 | 1457 10182 5762 | 2437 | 1.037 | 0.6872 | No | ||
| 26 | POLL | 23658 3688 | 2445 | 1.028 | 0.6936 | No | ||
| 27 | POLR2G | 23753 | 2511 | 0.997 | 0.6967 | No | ||
| 28 | POLR2A | 5394 | 2654 | 0.858 | 0.6948 | No | ||
| 29 | TXNRD1 | 19923 | 2783 | 0.740 | 0.6928 | No | ||
| 30 | ECGF1 | 22160 | 2820 | 0.712 | 0.6956 | No | ||
| 31 | AK3L1 | 8564 | 3394 | 0.355 | 0.6671 | No | ||
| 32 | NT5E | 19360 18702 | 3579 | 0.307 | 0.6592 | No | ||
| 33 | POLQ | 13407 22768 | 4465 | 0.154 | 0.6126 | No | ||
| 34 | UPB1 | 19988 3389 | 4785 | 0.126 | 0.5962 | No | ||
| 35 | ENTPD1 | 4495 | 6425 | 0.055 | 0.5083 | No | ||
| 36 | DPYD | 15437 | 6864 | 0.045 | 0.4850 | No | ||
| 37 | UPP1 | 20947 1385 | 9017 | 0.011 | 0.3692 | No | ||
| 38 | ITPA | 9193 | 10239 | -0.004 | 0.3034 | No | ||
| 39 | CDA | 15702 | 11081 | -0.015 | 0.2582 | No | ||
| 40 | POLR2B | 16817 | 11867 | -0.028 | 0.2161 | No | ||
| 41 | DPYS | 22305 | 12213 | -0.034 | 0.1978 | No | ||
| 42 | POLR2C | 9750 | 12998 | -0.054 | 0.1559 | No | ||
| 43 | CANT1 | 13304 | 14576 | -0.162 | 0.0720 | No | ||
| 44 | POLS | 9963 | 15177 | -0.283 | 0.0416 | No | ||
| 45 | TYMS | 5810 5809 3606 3598 | 16166 | -0.895 | -0.0057 | No | ||
| 46 | CTPS2 | 12060 2571 | 16323 | -1.017 | -0.0073 | No | ||
| 47 | POLB | 9599 | 16800 | -1.662 | -0.0219 | No | ||
| 48 | NT5C | 20151 | 16823 | -1.699 | -0.0118 | No | ||
| 49 | UCK1 | 10254 5831 10253 | 17118 | -2.107 | -0.0136 | No | ||
| 50 | POLD1 | 17847 | 17439 | -2.709 | -0.0129 | No | ||
| 51 | DCK | 16808 | 17923 | -3.959 | -0.0126 | No | ||
| 52 | TK2 | 18779 | 18514 | -7.500 | 0.0055 | No |