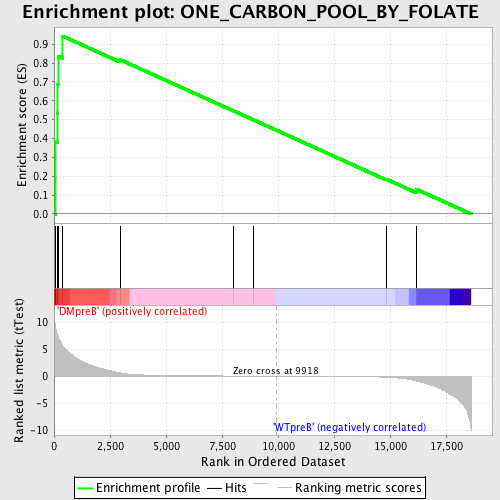
Profile of the Running ES Score & Positions of GeneSet Members on the Rank Ordered List
| Dataset | Set_04_DMpreB_versus_WTpreB.phenotype_DMpreB_versus_WTpreB.cls #DMpreB_versus_WTpreB |
| Phenotype | phenotype_DMpreB_versus_WTpreB.cls#DMpreB_versus_WTpreB |
| Upregulated in class | DMpreB |
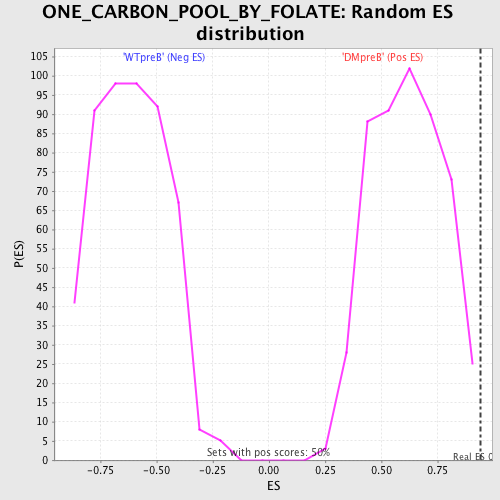
| GeneSet | ONE_CARBON_POOL_BY_FOLATE |
| Enrichment Score (ES) | 0.9428763 |
| Normalized Enrichment Score (NES) | 1.5391971 |
| Nominal p-value | 0.0020 |
| FDR q-value | 0.13737002 |
| FWER p-Value | 0.799 |
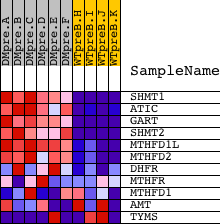
| PROBE | DESCRIPTION (from dataset) | GENE SYMBOL | GENE_TITLE | RANK IN GENE LIST | RANK METRIC SCORE | RUNNING ES | CORE ENRICHMENT | |
|---|---|---|---|---|---|---|---|---|
| 1 | SHMT1 | 5431 | 52 | 9.353 | 0.1925 | Yes | ||
| 2 | ATIC | 14231 3968 | 53 | 9.237 | 0.3854 | Yes | ||
| 3 | GART | 22543 1754 | 159 | 7.447 | 0.5353 | Yes | ||
| 4 | SHMT2 | 3307 19601 | 169 | 7.348 | 0.6883 | Yes | ||
| 5 | MTHFD1L | 11300 | 186 | 7.164 | 0.8370 | Yes | ||
| 6 | MTHFD2 | 17100 | 389 | 5.587 | 0.9429 | Yes | ||
| 7 | DHFR | 21590 | 2941 | 0.609 | 0.8185 | No | ||
| 8 | MTHFR | 5130 | 7991 | 0.025 | 0.5476 | No | ||
| 9 | MTHFD1 | 2132 21238 | 8889 | 0.013 | 0.4997 | No | ||
| 10 | AMT | 322 | 14832 | -0.205 | 0.1846 | No | ||
| 11 | TYMS | 5810 5809 3606 3598 | 16166 | -0.895 | 0.1317 | No |