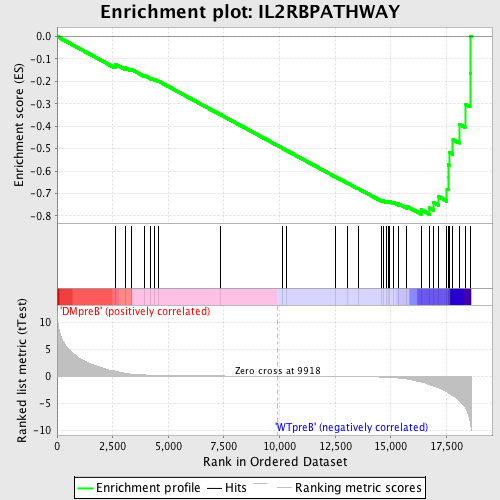
Profile of the Running ES Score & Positions of GeneSet Members on the Rank Ordered List
| Dataset | Set_04_DMpreB_versus_WTpreB.phenotype_DMpreB_versus_WTpreB.cls #DMpreB_versus_WTpreB |
| Phenotype | phenotype_DMpreB_versus_WTpreB.cls#DMpreB_versus_WTpreB |
| Upregulated in class | WTpreB |
| GeneSet | IL2RBPATHWAY |
| Enrichment Score (ES) | -0.79342896 |
| Normalized Enrichment Score (NES) | -1.6208203 |
| Nominal p-value | 0.010706638 |
| FDR q-value | 0.028753743 |
| FWER p-Value | 0.35 |
| PROBE | DESCRIPTION (from dataset) | GENE SYMBOL | GENE_TITLE | RANK IN GENE LIST | RANK METRIC SCORE | RUNNING ES | CORE ENRICHMENT | |
|---|---|---|---|---|---|---|---|---|
| 1 | HRAS | 4868 | 2610 | 0.906 | -0.1239 | No | ||
| 2 | IL2RB | 22219 | 3089 | 0.502 | -0.1404 | No | ||
| 3 | SOCS3 | 20131 | 3325 | 0.381 | -0.1461 | No | ||
| 4 | SHC1 | 9813 9812 5430 | 3936 | 0.225 | -0.1748 | No | ||
| 5 | AKT1 | 8568 | 4218 | 0.183 | -0.1866 | No | ||
| 6 | BCL2 | 8651 3928 13864 4435 981 4062 13863 4027 | 4380 | 0.162 | -0.1923 | No | ||
| 7 | E2F1 | 14384 | 4565 | 0.144 | -0.1996 | No | ||
| 8 | STAT5B | 20222 | 7325 | 0.036 | -0.3474 | No | ||
| 9 | CFLAR | 8738 4517 | 10118 | -0.002 | -0.4976 | No | ||
| 10 | IRS1 | 4925 | 10290 | -0.005 | -0.5067 | No | ||
| 11 | PIK3R1 | 3170 | 12502 | -0.041 | -0.6249 | No | ||
| 12 | SOS1 | 5476 | 13046 | -0.056 | -0.6531 | No | ||
| 13 | PIK3CA | 9562 | 13540 | -0.075 | -0.6783 | No | ||
| 14 | CBL | 19154 | 14602 | -0.166 | -0.7324 | No | ||
| 15 | NMI | 14590 | 14649 | -0.174 | -0.7317 | No | ||
| 16 | FOS | 21202 | 14800 | -0.201 | -0.7361 | No | ||
| 17 | IL2RG | 24096 | 14876 | -0.214 | -0.7362 | No | ||
| 18 | PPIA | 1284 11188 | 14937 | -0.225 | -0.7353 | No | ||
| 19 | STAT5A | 20664 | 15113 | -0.268 | -0.7398 | No | ||
| 20 | MYC | 22465 9435 | 15334 | -0.330 | -0.7456 | No | ||
| 21 | RPS6KB1 | 7815 1207 13040 | 15722 | -0.503 | -0.7573 | No | ||
| 22 | JAK3 | 9198 4936 | 16361 | -1.051 | -0.7724 | Yes | ||
| 23 | JAK1 | 15827 | 16753 | -1.590 | -0.7644 | Yes | ||
| 24 | MAPK3 | 6458 11170 | 16931 | -1.809 | -0.7408 | Yes | ||
| 25 | RAF1 | 17035 | 17131 | -2.125 | -0.7127 | Yes | ||
| 26 | BAD | 24000 | 17524 | -2.914 | -0.6805 | Yes | ||
| 27 | CRKL | 4560 | 17588 | -3.053 | -0.6281 | Yes | ||
| 28 | GRB2 | 20149 | 17590 | -3.055 | -0.5724 | Yes | ||
| 29 | IL2RA | 4918 | 17622 | -3.145 | -0.5166 | Yes | ||
| 30 | SOCS1 | 4522 | 17793 | -3.598 | -0.4600 | Yes | ||
| 31 | SYK | 21636 | 18074 | -4.548 | -0.3919 | Yes | ||
| 32 | BCL2L1 | 4440 2930 8652 | 18337 | -5.711 | -0.3016 | Yes | ||
| 33 | PTPN6 | 17002 | 18561 | -8.216 | -0.1635 | Yes | ||
| 34 | MAPK1 | 1642 11167 | 18592 | -9.104 | 0.0013 | Yes |

