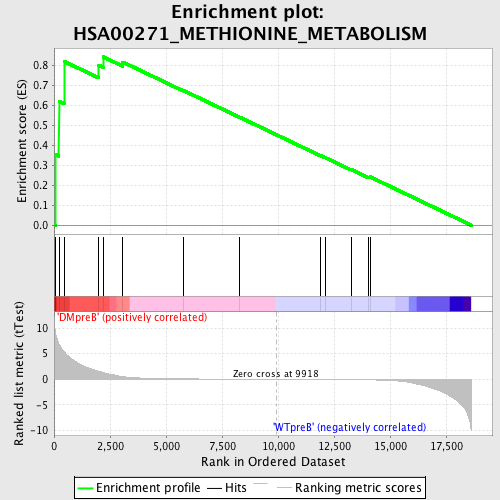
Profile of the Running ES Score & Positions of GeneSet Members on the Rank Ordered List
| Dataset | Set_04_DMpreB_versus_WTpreB.phenotype_DMpreB_versus_WTpreB.cls #DMpreB_versus_WTpreB |
| Phenotype | phenotype_DMpreB_versus_WTpreB.cls#DMpreB_versus_WTpreB |
| Upregulated in class | DMpreB |
| GeneSet | HSA00271_METHIONINE_METABOLISM |
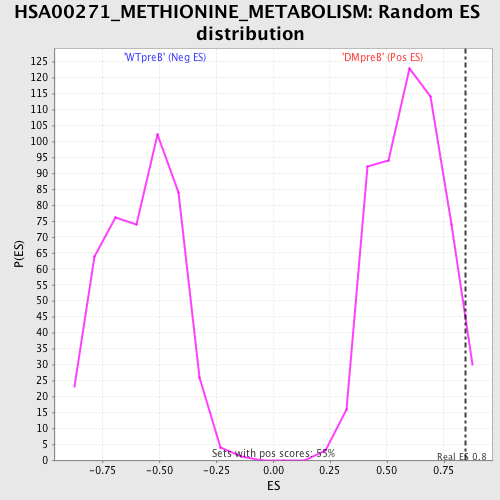
| Enrichment Score (ES) | 0.8442156 |
| Normalized Enrichment Score (NES) | 1.4118124 |
| Nominal p-value | 0.034798536 |
| FDR q-value | 0.35357982 |
| FWER p-Value | 1.0 |
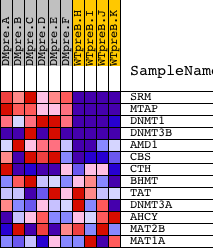
| PROBE | DESCRIPTION (from dataset) | GENE SYMBOL | GENE_TITLE | RANK IN GENE LIST | RANK METRIC SCORE | RUNNING ES | CORE ENRICHMENT | |
|---|---|---|---|---|---|---|---|---|
| 1 | SRM | 9890 2525 | 73 | 8.902 | 0.3537 | Yes | ||
| 2 | MTAP | 16178 | 218 | 6.863 | 0.6217 | Yes | ||
| 3 | DNMT1 | 19217 | 456 | 5.277 | 0.8210 | Yes | ||
| 4 | DNMT3B | 2840 14785 | 1986 | 1.573 | 0.8020 | Yes | ||
| 5 | AMD1 | 8583 | 2190 | 1.323 | 0.8442 | Yes | ||
| 6 | CBS | 1550 23034 | 3065 | 0.520 | 0.8181 | No | ||
| 7 | CTH | 1938 15131 | 5768 | 0.074 | 0.6759 | No | ||
| 8 | BHMT | 4446 | 8266 | 0.021 | 0.5425 | No | ||
| 9 | TAT | 18468 | 11896 | -0.028 | 0.3486 | No | ||
| 10 | DNMT3A | 2167 21330 | 12095 | -0.032 | 0.3392 | No | ||
| 11 | AHCY | 6526 | 13253 | -0.063 | 0.2795 | No | ||
| 12 | MAT2B | 20494 1431 | 14039 | -0.105 | 0.2415 | No | ||
| 13 | MAT1A | 22041 | 14105 | -0.110 | 0.2425 | No |