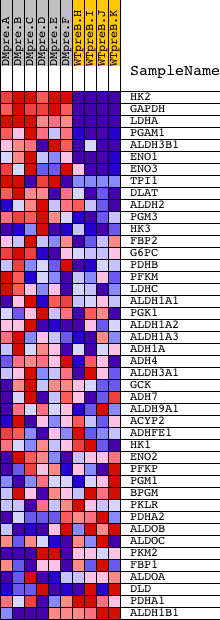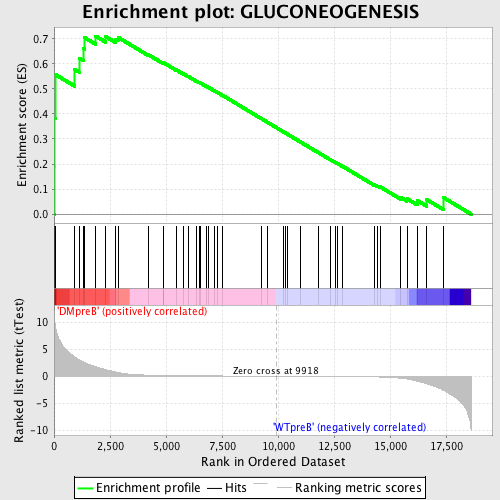
Profile of the Running ES Score & Positions of GeneSet Members on the Rank Ordered List
| Dataset | Set_04_DMpreB_versus_WTpreB.phenotype_DMpreB_versus_WTpreB.cls #DMpreB_versus_WTpreB |
| Phenotype | phenotype_DMpreB_versus_WTpreB.cls#DMpreB_versus_WTpreB |
| Upregulated in class | DMpreB |
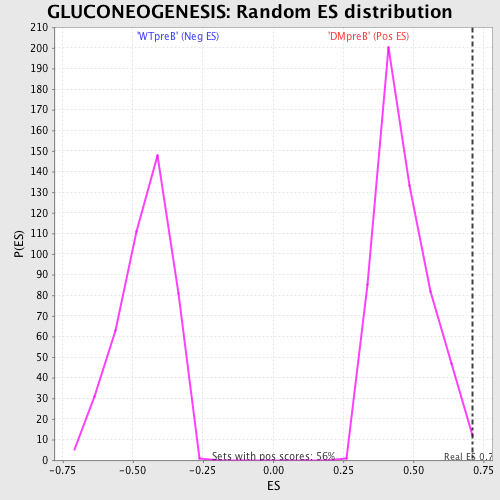
| GeneSet | GLUCONEOGENESIS |
| Enrichment Score (ES) | 0.7105771 |
| Normalized Enrichment Score (NES) | 1.527009 |
| Nominal p-value | 0.008928572 |
| FDR q-value | 0.13766663 |
| FWER p-Value | 0.865 |
| PROBE | DESCRIPTION (from dataset) | GENE SYMBOL | GENE_TITLE | RANK IN GENE LIST | RANK METRIC SCORE | RUNNING ES | CORE ENRICHMENT | |
|---|---|---|---|---|---|---|---|---|
| 1 | HK2 | 17106 | 24 | 10.278 | 0.1911 | Yes | ||
| 2 | GAPDH | 348 348 9002 | 25 | 10.273 | 0.3833 | Yes | ||
| 3 | LDHA | 9269 | 51 | 9.381 | 0.5576 | Yes | ||
| 4 | PGAM1 | 9556 | 925 | 3.571 | 0.5774 | Yes | ||
| 5 | ALDH3B1 | 12569 23949 | 1142 | 2.990 | 0.6217 | Yes | ||
| 6 | ENO1 | 8903 | 1323 | 2.578 | 0.6603 | Yes | ||
| 7 | ENO3 | 8905 | 1366 | 2.485 | 0.7045 | Yes | ||
| 8 | TPI1 | 5795 10212 | 1858 | 1.737 | 0.7106 | Yes | ||
| 9 | DLAT | 19123 | 2303 | 1.172 | 0.7086 | No | ||
| 10 | ALDH2 | 16384 | 2757 | 0.760 | 0.6984 | No | ||
| 11 | PGM3 | 19045 | 2856 | 0.671 | 0.7057 | No | ||
| 12 | HK3 | 3224 477 | 4213 | 0.183 | 0.6361 | No | ||
| 13 | FBP2 | 21422 | 4862 | 0.121 | 0.6035 | No | ||
| 14 | G6PC | 20656 | 4892 | 0.119 | 0.6042 | No | ||
| 15 | PDHB | 12670 7548 | 5450 | 0.088 | 0.5758 | No | ||
| 16 | PFKM | 5243 9554 | 5761 | 0.074 | 0.5605 | No | ||
| 17 | LDHC | 18235 2235 | 5978 | 0.067 | 0.5502 | No | ||
| 18 | ALDH1A1 | 8569 | 6352 | 0.057 | 0.5311 | No | ||
| 19 | PGK1 | 9557 5244 | 6483 | 0.054 | 0.5251 | No | ||
| 20 | ALDH1A2 | 19386 | 6554 | 0.052 | 0.5223 | No | ||
| 21 | ALDH1A3 | 17802 | 6818 | 0.046 | 0.5090 | No | ||
| 22 | ADH1A | 15406 | 6905 | 0.044 | 0.5052 | No | ||
| 23 | ADH4 | 15405 | 7177 | 0.039 | 0.4914 | No | ||
| 24 | ALDH3A1 | 20854 | 7298 | 0.037 | 0.4856 | No | ||
| 25 | GCK | 20535 | 7530 | 0.032 | 0.4738 | No | ||
| 26 | ADH7 | 15408 | 9270 | 0.008 | 0.3803 | No | ||
| 27 | ALDH9A1 | 14064 | 9534 | 0.005 | 0.3662 | No | ||
| 28 | ACYP2 | 20508 | 10255 | -0.004 | 0.3275 | No | ||
| 29 | ADHFE1 | 4049 8008 | 10318 | -0.005 | 0.3243 | No | ||
| 30 | HK1 | 4854 | 10400 | -0.006 | 0.3200 | No | ||
| 31 | ENO2 | 8904 | 11015 | -0.014 | 0.2872 | No | ||
| 32 | PFKP | 3267 3168 7118 | 11780 | -0.026 | 0.2466 | No | ||
| 33 | PGM1 | 16841 | 12334 | -0.037 | 0.2175 | No | ||
| 34 | BPGM | 17489 | 12579 | -0.043 | 0.2052 | No | ||
| 35 | PKLR | 1850 15545 | 12650 | -0.046 | 0.2023 | No | ||
| 36 | PDHA2 | 15153 | 12881 | -0.051 | 0.1908 | No | ||
| 37 | ALDOB | 10494 | 14301 | -0.129 | 0.1169 | No | ||
| 38 | ALDOC | 20759 311 | 14449 | -0.146 | 0.1117 | No | ||
| 39 | PKM2 | 3642 9573 | 14550 | -0.157 | 0.1092 | No | ||
| 40 | FBP1 | 21423 | 15479 | -0.382 | 0.0664 | No | ||
| 41 | ALDOA | 8572 | 15753 | -0.521 | 0.0615 | No | ||
| 42 | DLD | 2097 21090 | 16216 | -0.942 | 0.0542 | No | ||
| 43 | PDHA1 | 24020 | 16629 | -1.404 | 0.0583 | No | ||
| 44 | ALDH1B1 | 16219 | 17375 | -2.598 | 0.0668 | No |