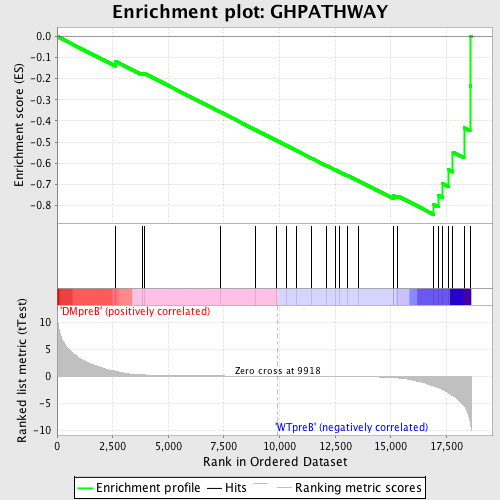
Profile of the Running ES Score & Positions of GeneSet Members on the Rank Ordered List
| Dataset | Set_04_DMpreB_versus_WTpreB.phenotype_DMpreB_versus_WTpreB.cls #DMpreB_versus_WTpreB |
| Phenotype | phenotype_DMpreB_versus_WTpreB.cls#DMpreB_versus_WTpreB |
| Upregulated in class | WTpreB |
| GeneSet | GHPATHWAY |
| Enrichment Score (ES) | -0.8429547 |
| Normalized Enrichment Score (NES) | -1.6406937 |
| Nominal p-value | 0.0 |
| FDR q-value | 0.03303866 |
| FWER p-Value | 0.252 |
| PROBE | DESCRIPTION (from dataset) | GENE SYMBOL | GENE_TITLE | RANK IN GENE LIST | RANK METRIC SCORE | RUNNING ES | CORE ENRICHMENT | |
|---|---|---|---|---|---|---|---|---|
| 1 | HRAS | 4868 | 2610 | 0.906 | -0.1168 | No | ||
| 2 | SRF | 22961 1597 | 3826 | 0.245 | -0.1758 | No | ||
| 3 | SHC1 | 9813 9812 5430 | 3936 | 0.225 | -0.1758 | No | ||
| 4 | STAT5B | 20222 | 7325 | 0.036 | -0.3571 | No | ||
| 5 | TCF1 | 16416 | 8918 | 0.013 | -0.4424 | No | ||
| 6 | GHR | 22336 | 9880 | 0.000 | -0.4941 | No | ||
| 7 | IRS1 | 4925 | 10290 | -0.005 | -0.5160 | No | ||
| 8 | RPS6KA1 | 15725 | 10766 | -0.011 | -0.5413 | No | ||
| 9 | INSR | 18950 | 11423 | -0.020 | -0.5760 | No | ||
| 10 | SLC2A4 | 20380 | 12102 | -0.032 | -0.6117 | No | ||
| 11 | PIK3R1 | 3170 | 12502 | -0.041 | -0.6320 | No | ||
| 12 | PLCG1 | 14753 | 12675 | -0.046 | -0.6401 | No | ||
| 13 | SOS1 | 5476 | 13046 | -0.056 | -0.6586 | No | ||
| 14 | PIK3CA | 9562 | 13540 | -0.075 | -0.6831 | No | ||
| 15 | JAK2 | 23893 9197 3706 | 15111 | -0.267 | -0.7606 | No | ||
| 16 | STAT5A | 20664 | 15113 | -0.268 | -0.7537 | No | ||
| 17 | MAP2K1 | 19082 | 15318 | -0.325 | -0.7563 | No | ||
| 18 | MAPK3 | 6458 11170 | 16931 | -1.809 | -0.7959 | Yes | ||
| 19 | RAF1 | 17035 | 17131 | -2.125 | -0.7514 | Yes | ||
| 20 | PRKCA | 20174 | 17337 | -2.525 | -0.6969 | Yes | ||
| 21 | GRB2 | 20149 | 17590 | -3.055 | -0.6311 | Yes | ||
| 22 | SOCS1 | 4522 | 17793 | -3.598 | -0.5485 | Yes | ||
| 23 | PRKCB1 | 1693 9574 | 18292 | -5.486 | -0.4327 | Yes | ||
| 24 | PTPN6 | 17002 | 18561 | -8.216 | -0.2336 | Yes | ||
| 25 | MAPK1 | 1642 11167 | 18592 | -9.104 | 0.0013 | Yes |

