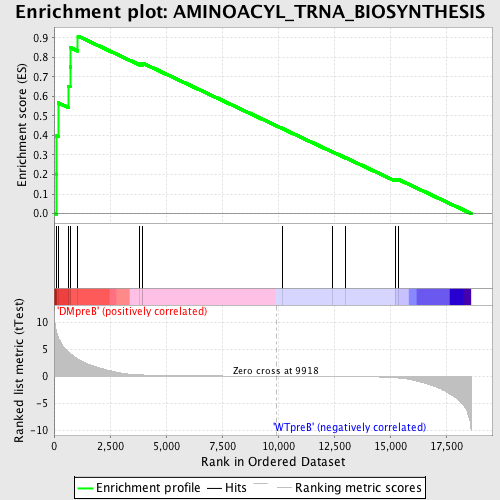
Profile of the Running ES Score & Positions of GeneSet Members on the Rank Ordered List
| Dataset | Set_04_DMpreB_versus_WTpreB.phenotype_DMpreB_versus_WTpreB.cls #DMpreB_versus_WTpreB |
| Phenotype | phenotype_DMpreB_versus_WTpreB.cls#DMpreB_versus_WTpreB |
| Upregulated in class | DMpreB |
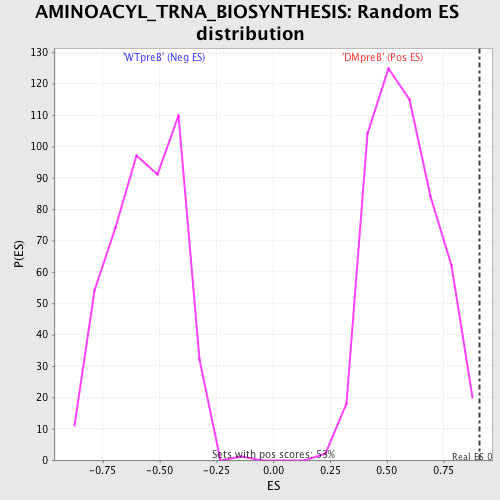
| GeneSet | AMINOACYL_TRNA_BIOSYNTHESIS |
| Enrichment Score (ES) | 0.9085728 |
| Normalized Enrichment Score (NES) | 1.581112 |
| Nominal p-value | 0.0018867925 |
| FDR q-value | 0.08996775 |
| FWER p-Value | 0.484 |
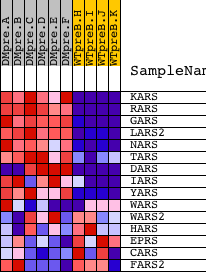
| PROBE | DESCRIPTION (from dataset) | GENE SYMBOL | GENE_TITLE | RANK IN GENE LIST | RANK METRIC SCORE | RUNNING ES | CORE ENRICHMENT | |
|---|---|---|---|---|---|---|---|---|
| 1 | KARS | 18738 | 89 | 8.533 | 0.2026 | Yes | ||
| 2 | RARS | 20496 | 112 | 8.069 | 0.3975 | Yes | ||
| 3 | GARS | 17438 | 189 | 7.134 | 0.5668 | Yes | ||
| 4 | LARS2 | 19255 | 629 | 4.507 | 0.6528 | Yes | ||
| 5 | NARS | 23418 | 715 | 4.220 | 0.7507 | Yes | ||
| 6 | TARS | 22325 8502 | 745 | 4.119 | 0.8493 | Yes | ||
| 7 | DARS | 10375 13846 | 1065 | 3.145 | 0.9086 | Yes | ||
| 8 | IARS | 4190 8361 8362 | 3823 | 0.247 | 0.7664 | No | ||
| 9 | YARS | 16071 | 3945 | 0.223 | 0.7653 | No | ||
| 10 | WARS | 2085 20984 | 3955 | 0.221 | 0.7701 | No | ||
| 11 | WARS2 | 12884 7688 | 10214 | -0.004 | 0.4338 | No | ||
| 12 | HARS | 23451 | 12413 | -0.039 | 0.3166 | No | ||
| 13 | EPRS | 14014 | 13018 | -0.055 | 0.2855 | No | ||
| 14 | CARS | 1683 17544 | 15228 | -0.297 | 0.1739 | No | ||
| 15 | FARS2 | 21666 | 15351 | -0.335 | 0.1755 | No |