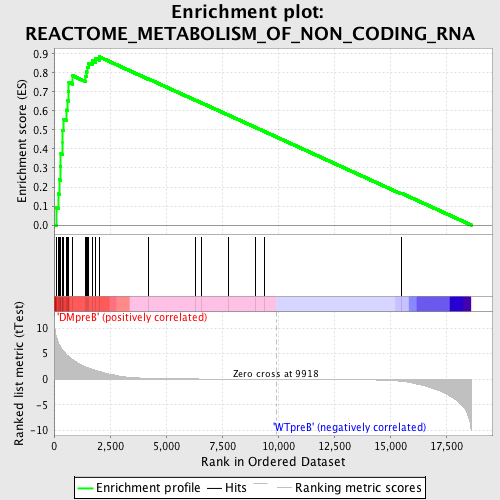
Profile of the Running ES Score & Positions of GeneSet Members on the Rank Ordered List
| Dataset | Set_04_DMpreB_versus_WTpreB.phenotype_DMpreB_versus_WTpreB.cls #DMpreB_versus_WTpreB |
| Phenotype | phenotype_DMpreB_versus_WTpreB.cls#DMpreB_versus_WTpreB |
| Upregulated in class | DMpreB |
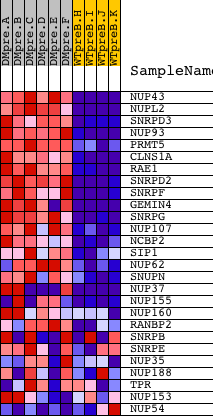
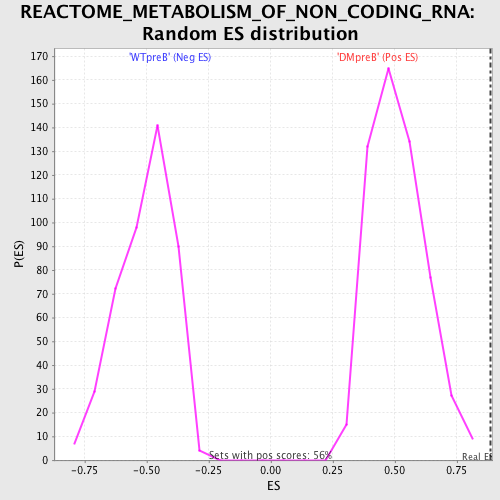
| GeneSet | REACTOME_METABOLISM_OF_NON_CODING_RNA |
| Enrichment Score (ES) | 0.8843624 |
| Normalized Enrichment Score (NES) | 1.734376 |
| Nominal p-value | 0.0 |
| FDR q-value | 0.0017883319 |
| FWER p-Value | 0.017 |
| PROBE | DESCRIPTION (from dataset) | GENE SYMBOL | GENE_TITLE | RANK IN GENE LIST | RANK METRIC SCORE | RUNNING ES | CORE ENRICHMENT | |
|---|---|---|---|---|---|---|---|---|
| 1 | NUP43 | 20094 | 90 | 8.530 | 0.0911 | Yes | ||
| 2 | NUPL2 | 6072 | 203 | 6.986 | 0.1636 | Yes | ||
| 3 | SNRPD3 | 12514 | 225 | 6.797 | 0.2389 | Yes | ||
| 4 | NUP93 | 7762 | 280 | 6.335 | 0.3072 | Yes | ||
| 5 | PRMT5 | 6571 2817 | 304 | 6.184 | 0.3755 | Yes | ||
| 6 | CLNS1A | 4526 4525 | 379 | 5.652 | 0.4351 | Yes | ||
| 7 | RAE1 | 12395 | 381 | 5.644 | 0.4985 | Yes | ||
| 8 | SNRPD2 | 8412 | 436 | 5.355 | 0.5558 | Yes | ||
| 9 | SNRPF | 7645 | 541 | 4.871 | 0.6050 | Yes | ||
| 10 | GEMIN4 | 6592 6591 | 612 | 4.590 | 0.6528 | Yes | ||
| 11 | SNRPG | 12622 | 632 | 4.487 | 0.7023 | Yes | ||
| 12 | NUP107 | 8337 | 661 | 4.422 | 0.7505 | Yes | ||
| 13 | NCBP2 | 12643 | 834 | 3.857 | 0.7846 | Yes | ||
| 14 | SIP1 | 21263 | 1418 | 2.390 | 0.7801 | Yes | ||
| 15 | NUP62 | 9497 | 1445 | 2.341 | 0.8050 | Yes | ||
| 16 | SNUPN | 12282 | 1469 | 2.305 | 0.8297 | Yes | ||
| 17 | NUP37 | 3294 3326 19909 | 1523 | 2.230 | 0.8519 | Yes | ||
| 18 | NUP155 | 2298 5027 | 1713 | 1.943 | 0.8636 | Yes | ||
| 19 | NUP160 | 14957 | 1842 | 1.755 | 0.8765 | Yes | ||
| 20 | RANBP2 | 20019 | 2017 | 1.536 | 0.8844 | Yes | ||
| 21 | SNRPB | 9842 5469 2736 | 4208 | 0.184 | 0.7686 | No | ||
| 22 | SNRPE | 9843 | 6295 | 0.058 | 0.6571 | No | ||
| 23 | NUP35 | 12803 | 6597 | 0.051 | 0.6414 | No | ||
| 24 | NUP188 | 15053 | 7801 | 0.028 | 0.5770 | No | ||
| 25 | TPR | 927 4255 | 8987 | 0.012 | 0.5134 | No | ||
| 26 | NUP153 | 21474 | 9407 | 0.006 | 0.4910 | No | ||
| 27 | NUP54 | 11231 11232 6516 | 15488 | -0.387 | 0.1683 | No |