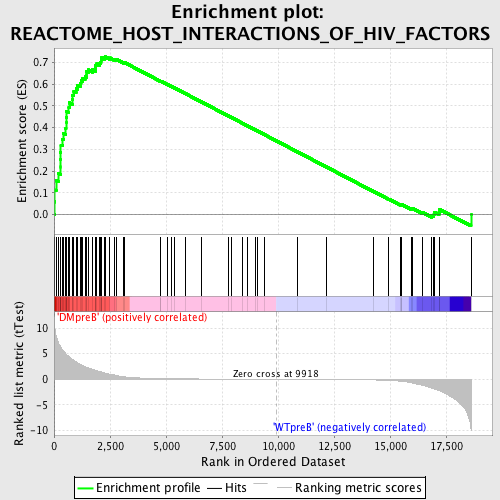
Profile of the Running ES Score & Positions of GeneSet Members on the Rank Ordered List
| Dataset | Set_04_DMpreB_versus_WTpreB.phenotype_DMpreB_versus_WTpreB.cls #DMpreB_versus_WTpreB |
| Phenotype | phenotype_DMpreB_versus_WTpreB.cls#DMpreB_versus_WTpreB |
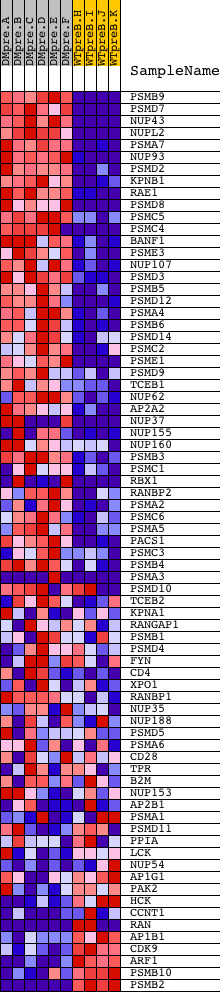
| Upregulated in class | DMpreB |
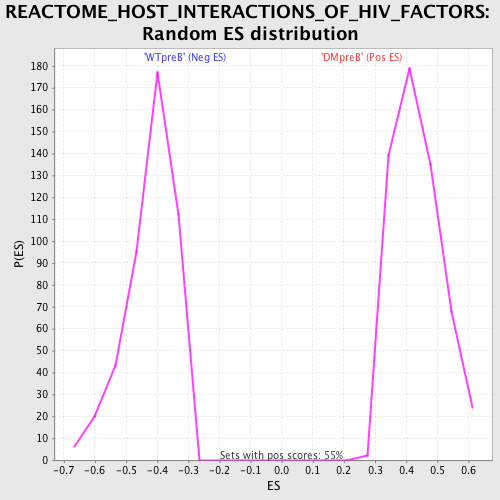
| GeneSet | REACTOME_HOST_INTERACTIONS_OF_HIV_FACTORS |
| Enrichment Score (ES) | 0.7257773 |
| Normalized Enrichment Score (NES) | 1.6673604 |
| Nominal p-value | 0.0 |
| FDR q-value | 0.0067227557 |
| FWER p-Value | 0.137 |
| PROBE | DESCRIPTION (from dataset) | GENE SYMBOL | GENE_TITLE | RANK IN GENE LIST | RANK METRIC SCORE | RUNNING ES | CORE ENRICHMENT | |
|---|---|---|---|---|---|---|---|---|
| 1 | PSMB9 | 23021 | 15 | 10.811 | 0.0581 | Yes | ||
| 2 | PSMD7 | 18752 3825 | 28 | 10.182 | 0.1129 | Yes | ||
| 3 | NUP43 | 20094 | 90 | 8.530 | 0.1561 | Yes | ||
| 4 | NUPL2 | 6072 | 203 | 6.986 | 0.1882 | Yes | ||
| 5 | PSMA7 | 14318 | 278 | 6.350 | 0.2188 | Yes | ||
| 6 | NUP93 | 7762 | 280 | 6.335 | 0.2533 | Yes | ||
| 7 | PSMD2 | 10137 5724 | 288 | 6.286 | 0.2871 | Yes | ||
| 8 | KPNB1 | 20274 | 306 | 6.181 | 0.3199 | Yes | ||
| 9 | RAE1 | 12395 | 381 | 5.644 | 0.3467 | Yes | ||
| 10 | PSMD8 | 7166 | 418 | 5.413 | 0.3742 | Yes | ||
| 11 | PSMC5 | 1348 20624 | 522 | 4.954 | 0.3957 | Yes | ||
| 12 | PSMC4 | 2141 17915 | 531 | 4.907 | 0.4220 | Yes | ||
| 13 | BANF1 | 6216 10706 3760 | 537 | 4.890 | 0.4484 | Yes | ||
| 14 | PSME3 | 20657 | 553 | 4.832 | 0.4739 | Yes | ||
| 15 | NUP107 | 8337 | 661 | 4.422 | 0.4922 | Yes | ||
| 16 | PSMD3 | 5803 | 692 | 4.290 | 0.5140 | Yes | ||
| 17 | PSMB5 | 9633 | 809 | 3.917 | 0.5291 | Yes | ||
| 18 | PSMD12 | 20621 | 821 | 3.878 | 0.5496 | Yes | ||
| 19 | PSMA4 | 11179 | 882 | 3.710 | 0.5666 | Yes | ||
| 20 | PSMB6 | 9634 | 981 | 3.372 | 0.5797 | Yes | ||
| 21 | PSMD14 | 15005 | 1037 | 3.216 | 0.5942 | Yes | ||
| 22 | PSMC2 | 16909 | 1164 | 2.940 | 0.6035 | Yes | ||
| 23 | PSME1 | 5300 9637 | 1201 | 2.861 | 0.6171 | Yes | ||
| 24 | PSMD9 | 3461 7393 | 1275 | 2.691 | 0.6278 | Yes | ||
| 25 | TCEB1 | 13995 | 1381 | 2.456 | 0.6356 | Yes | ||
| 26 | NUP62 | 9497 | 1445 | 2.341 | 0.6449 | Yes | ||
| 27 | AP2A2 | 18009 | 1448 | 2.337 | 0.6576 | Yes | ||
| 28 | NUP37 | 3294 3326 19909 | 1523 | 2.230 | 0.6657 | Yes | ||
| 29 | NUP155 | 2298 5027 | 1713 | 1.943 | 0.6661 | Yes | ||
| 30 | NUP160 | 14957 | 1842 | 1.755 | 0.6688 | Yes | ||
| 31 | PSMB3 | 11180 | 1849 | 1.748 | 0.6780 | Yes | ||
| 32 | PSMC1 | 9635 | 1857 | 1.738 | 0.6871 | Yes | ||
| 33 | RBX1 | 12130 7123 | 1911 | 1.661 | 0.6933 | Yes | ||
| 34 | RANBP2 | 20019 | 2017 | 1.536 | 0.6960 | Yes | ||
| 35 | PSMA2 | 9631 | 2075 | 1.465 | 0.7009 | Yes | ||
| 36 | PSMC6 | 7379 | 2094 | 1.448 | 0.7078 | Yes | ||
| 37 | PSMA5 | 6464 | 2098 | 1.446 | 0.7155 | Yes | ||
| 38 | PACS1 | 23975 | 2128 | 1.400 | 0.7216 | Yes | ||
| 39 | PSMC3 | 9636 | 2250 | 1.240 | 0.7218 | Yes | ||
| 40 | PSMB4 | 15252 | 2297 | 1.181 | 0.7258 | Yes | ||
| 41 | PSMA3 | 9632 5298 | 2493 | 1.000 | 0.7207 | No | ||
| 42 | PSMD10 | 2578 2597 24046 | 2709 | 0.811 | 0.7135 | No | ||
| 43 | TCEB2 | 12563 23102 7476 | 2802 | 0.726 | 0.7125 | No | ||
| 44 | KPNA1 | 22776 | 3097 | 0.498 | 0.6994 | No | ||
| 45 | RANGAP1 | 2180 22195 | 3162 | 0.457 | 0.6984 | No | ||
| 46 | PSMB1 | 23118 | 4750 | 0.128 | 0.6135 | No | ||
| 47 | PSMD4 | 15251 | 4763 | 0.127 | 0.6136 | No | ||
| 48 | FYN | 3375 3395 20052 | 5072 | 0.109 | 0.5976 | No | ||
| 49 | CD4 | 16999 | 5252 | 0.099 | 0.5884 | No | ||
| 50 | XPO1 | 4172 | 5363 | 0.093 | 0.5830 | No | ||
| 51 | RANBP1 | 9692 5357 | 5854 | 0.071 | 0.5570 | No | ||
| 52 | NUP35 | 12803 | 6597 | 0.051 | 0.5172 | No | ||
| 53 | NUP188 | 15053 | 7801 | 0.028 | 0.4525 | No | ||
| 54 | PSMD5 | 2774 14612 | 7934 | 0.026 | 0.4455 | No | ||
| 55 | PSMA6 | 21270 | 8391 | 0.019 | 0.4210 | No | ||
| 56 | CD28 | 14239 4092 | 8632 | 0.016 | 0.4082 | No | ||
| 57 | TPR | 927 4255 | 8987 | 0.012 | 0.3892 | No | ||
| 58 | B2M | 72 14882 | 9089 | 0.011 | 0.3838 | No | ||
| 59 | NUP153 | 21474 | 9407 | 0.006 | 0.3667 | No | ||
| 60 | AP2B1 | 12958 7752 12957 1280 | 10881 | -0.012 | 0.2873 | No | ||
| 61 | PSMA1 | 1627 17669 | 12144 | -0.033 | 0.2195 | No | ||
| 62 | PSMD11 | 12772 7600 | 14271 | -0.126 | 0.1055 | No | ||
| 63 | PPIA | 1284 11188 | 14937 | -0.225 | 0.0708 | No | ||
| 64 | LCK | 15746 | 15440 | -0.368 | 0.0458 | No | ||
| 65 | NUP54 | 11231 11232 6516 | 15488 | -0.387 | 0.0454 | No | ||
| 66 | AP1G1 | 4392 | 15515 | -0.404 | 0.0462 | No | ||
| 67 | PAK2 | 10310 5875 | 15938 | -0.671 | 0.0271 | No | ||
| 68 | HCK | 14787 | 15979 | -0.695 | 0.0287 | No | ||
| 69 | CCNT1 | 22140 11607 | 16429 | -1.133 | 0.0106 | No | ||
| 70 | RAN | 5356 9691 | 16867 | -1.732 | -0.0035 | No | ||
| 71 | AP1B1 | 8599 | 16957 | -1.842 | 0.0018 | No | ||
| 72 | CDK9 | 14619 | 16966 | -1.859 | 0.0115 | No | ||
| 73 | ARF1 | 64 | 17184 | -2.210 | 0.0118 | No | ||
| 74 | PSMB10 | 5299 18761 | 17214 | -2.264 | 0.0226 | No | ||
| 75 | PSMB2 | 2324 16078 | 18611 | -9.723 | 0.0003 | No |