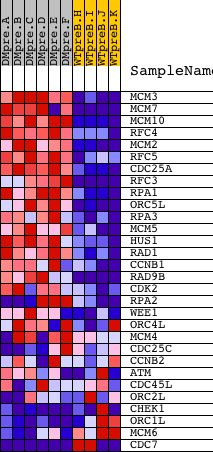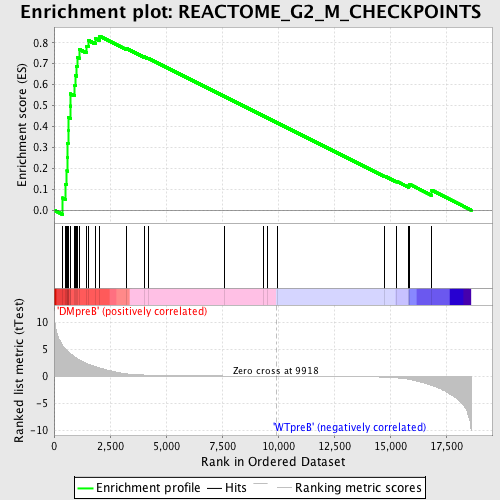
Profile of the Running ES Score & Positions of GeneSet Members on the Rank Ordered List
| Dataset | Set_04_DMpreB_versus_WTpreB.phenotype_DMpreB_versus_WTpreB.cls #DMpreB_versus_WTpreB |
| Phenotype | phenotype_DMpreB_versus_WTpreB.cls#DMpreB_versus_WTpreB |
| Upregulated in class | DMpreB |
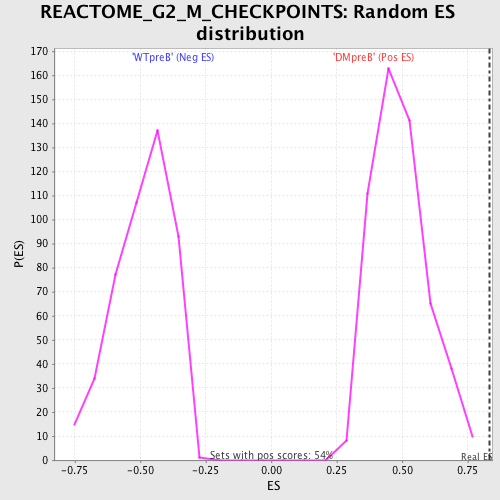
| GeneSet | REACTOME_G2_M_CHECKPOINTS |
| Enrichment Score (ES) | 0.8317118 |
| Normalized Enrichment Score (NES) | 1.6899683 |
| Nominal p-value | 0.0 |
| FDR q-value | 0.0051254253 |
| FWER p-Value | 0.071 |
| PROBE | DESCRIPTION (from dataset) | GENE SYMBOL | GENE_TITLE | RANK IN GENE LIST | RANK METRIC SCORE | RUNNING ES | CORE ENRICHMENT | |
|---|---|---|---|---|---|---|---|---|
| 1 | MCM3 | 13991 | 390 | 5.583 | 0.0580 | Yes | ||
| 2 | MCM7 | 9372 3568 | 497 | 5.089 | 0.1242 | Yes | ||
| 3 | MCM10 | 14694 | 573 | 4.728 | 0.1871 | Yes | ||
| 4 | RFC4 | 1735 22627 | 589 | 4.674 | 0.2524 | Yes | ||
| 5 | MCM2 | 17074 | 598 | 4.627 | 0.3174 | Yes | ||
| 6 | RFC5 | 13005 7791 | 625 | 4.526 | 0.3800 | Yes | ||
| 7 | CDC25A | 8721 | 631 | 4.494 | 0.4433 | Yes | ||
| 8 | RFC3 | 12786 | 722 | 4.193 | 0.4977 | Yes | ||
| 9 | RPA1 | 20349 | 739 | 4.140 | 0.5554 | Yes | ||
| 10 | ORC5L | 11173 3595 | 924 | 3.572 | 0.5960 | Yes | ||
| 11 | RPA3 | 12667 | 963 | 3.441 | 0.6427 | Yes | ||
| 12 | MCM5 | 18564 | 1005 | 3.303 | 0.6872 | Yes | ||
| 13 | HUS1 | 9138 4890 | 1030 | 3.225 | 0.7315 | Yes | ||
| 14 | RAD1 | 22507 | 1132 | 3.006 | 0.7686 | Yes | ||
| 15 | CCNB1 | 11201 21362 | 1458 | 2.324 | 0.7840 | Yes | ||
| 16 | RAD9B | 10541 | 1534 | 2.223 | 0.8114 | Yes | ||
| 17 | CDK2 | 3438 3373 19592 3322 | 1846 | 1.753 | 0.8194 | Yes | ||
| 18 | RPA2 | 2330 16057 | 2021 | 1.531 | 0.8317 | Yes | ||
| 19 | WEE1 | 18127 | 3229 | 0.429 | 0.7728 | No | ||
| 20 | ORC4L | 11172 6460 | 4035 | 0.208 | 0.7325 | No | ||
| 21 | MCM4 | 22655 1708 | 4196 | 0.186 | 0.7265 | No | ||
| 22 | CDC25C | 23468 1954 1977 | 7624 | 0.031 | 0.5426 | No | ||
| 23 | CCNB2 | 19067 | 9366 | 0.007 | 0.4490 | No | ||
| 24 | ATM | 2976 19115 | 9513 | 0.005 | 0.4412 | No | ||
| 25 | CDC45L | 22642 1752 | 9951 | -0.001 | 0.4177 | No | ||
| 26 | ORC2L | 385 13949 | 14740 | -0.190 | 0.1628 | No | ||
| 27 | CHEK1 | 19181 3085 | 15272 | -0.310 | 0.1386 | No | ||
| 28 | ORC1L | 327 16144 | 15837 | -0.579 | 0.1165 | No | ||
| 29 | MCM6 | 4000 13845 4119 | 15865 | -0.608 | 0.1236 | No | ||
| 30 | CDC7 | 16765 3477 | 16851 | -1.722 | 0.0950 | No |