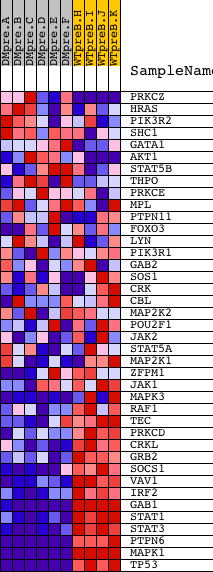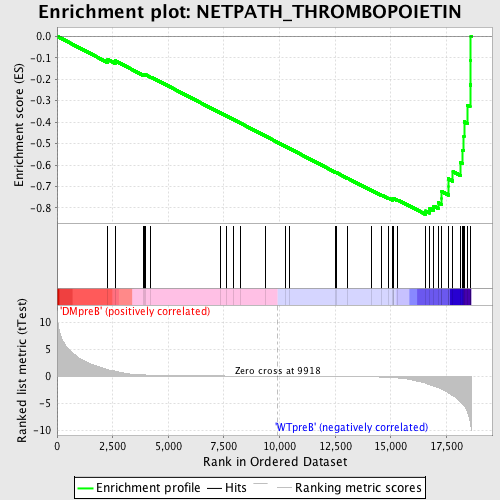
Profile of the Running ES Score & Positions of GeneSet Members on the Rank Ordered List
| Dataset | Set_04_DMpreB_versus_WTpreB.phenotype_DMpreB_versus_WTpreB.cls #DMpreB_versus_WTpreB |
| Phenotype | phenotype_DMpreB_versus_WTpreB.cls#DMpreB_versus_WTpreB |
| Upregulated in class | WTpreB |
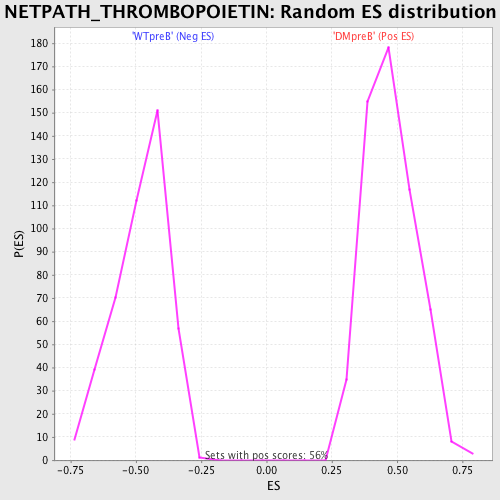
| GeneSet | NETPATH_THROMBOPOIETIN |
| Enrichment Score (ES) | -0.830426 |
| Normalized Enrichment Score (NES) | -1.7375429 |
| Nominal p-value | 0.0 |
| FDR q-value | 0.008538842 |
| FWER p-Value | 0.042 |
| PROBE | DESCRIPTION (from dataset) | GENE SYMBOL | GENE_TITLE | RANK IN GENE LIST | RANK METRIC SCORE | RUNNING ES | CORE ENRICHMENT | |
|---|---|---|---|---|---|---|---|---|
| 1 | PRKCZ | 5260 | 2281 | 1.203 | -0.1078 | No | ||
| 2 | HRAS | 4868 | 2610 | 0.906 | -0.1142 | No | ||
| 3 | PIK3R2 | 18850 | 3888 | 0.232 | -0.1801 | No | ||
| 4 | SHC1 | 9813 9812 5430 | 3936 | 0.225 | -0.1798 | No | ||
| 5 | GATA1 | 24196 | 3956 | 0.221 | -0.1781 | No | ||
| 6 | AKT1 | 8568 | 4218 | 0.183 | -0.1898 | No | ||
| 7 | STAT5B | 20222 | 7325 | 0.036 | -0.3566 | No | ||
| 8 | THPO | 22636 | 7609 | 0.031 | -0.3714 | No | ||
| 9 | PRKCE | 9575 | 7915 | 0.026 | -0.3875 | No | ||
| 10 | MPL | 15780 | 8264 | 0.021 | -0.4060 | No | ||
| 11 | PTPN11 | 5326 16391 9660 | 9360 | 0.007 | -0.4649 | No | ||
| 12 | FOXO3 | 19782 3402 | 10283 | -0.004 | -0.5144 | No | ||
| 13 | LYN | 16281 | 10463 | -0.007 | -0.5240 | No | ||
| 14 | PIK3R1 | 3170 | 12502 | -0.041 | -0.6332 | No | ||
| 15 | GAB2 | 1821 18184 2025 | 12548 | -0.043 | -0.6351 | No | ||
| 16 | SOS1 | 5476 | 13046 | -0.056 | -0.6611 | No | ||
| 17 | CRK | 4559 1249 | 14137 | -0.112 | -0.7184 | No | ||
| 18 | CBL | 19154 | 14602 | -0.166 | -0.7413 | No | ||
| 19 | MAP2K2 | 19933 | 14908 | -0.221 | -0.7550 | No | ||
| 20 | POU2F1 | 5275 3989 4065 4010 | 15082 | -0.259 | -0.7611 | No | ||
| 21 | JAK2 | 23893 9197 3706 | 15111 | -0.267 | -0.7593 | No | ||
| 22 | STAT5A | 20664 | 15113 | -0.268 | -0.7560 | No | ||
| 23 | MAP2K1 | 19082 | 15318 | -0.325 | -0.7629 | No | ||
| 24 | ZFPM1 | 18439 | 16573 | -1.314 | -0.8141 | Yes | ||
| 25 | JAK1 | 15827 | 16753 | -1.590 | -0.8039 | Yes | ||
| 26 | MAPK3 | 6458 11170 | 16931 | -1.809 | -0.7909 | Yes | ||
| 27 | RAF1 | 17035 | 17131 | -2.125 | -0.7752 | Yes | ||
| 28 | TEC | 16514 | 17287 | -2.394 | -0.7538 | Yes | ||
| 29 | PRKCD | 21897 | 17290 | -2.395 | -0.7241 | Yes | ||
| 30 | CRKL | 4560 | 17588 | -3.053 | -0.7021 | Yes | ||
| 31 | GRB2 | 20149 | 17590 | -3.055 | -0.6642 | Yes | ||
| 32 | SOCS1 | 4522 | 17793 | -3.598 | -0.6303 | Yes | ||
| 33 | VAV1 | 23173 | 18136 | -4.751 | -0.5896 | Yes | ||
| 34 | IRF2 | 18621 | 18217 | -5.102 | -0.5304 | Yes | ||
| 35 | GAB1 | 18828 | 18283 | -5.430 | -0.4664 | Yes | ||
| 36 | STAT1 | 3936 5524 | 18294 | -5.505 | -0.3984 | Yes | ||
| 37 | STAT3 | 5525 9906 | 18455 | -6.760 | -0.3229 | Yes | ||
| 38 | PTPN6 | 17002 | 18561 | -8.216 | -0.2264 | Yes | ||
| 39 | MAPK1 | 1642 11167 | 18592 | -9.104 | -0.1147 | Yes | ||
| 40 | TP53 | 20822 | 18601 | -9.320 | 0.0008 | Yes |