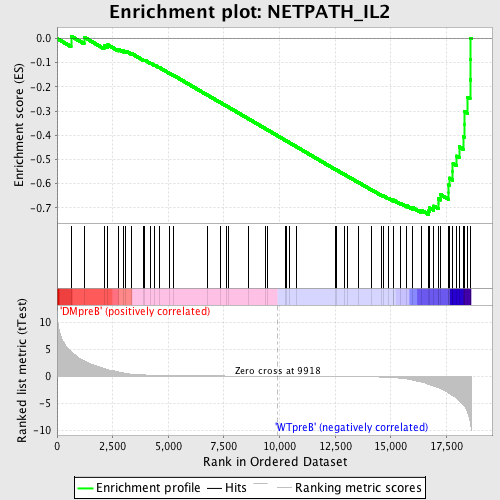
Profile of the Running ES Score & Positions of GeneSet Members on the Rank Ordered List
| Dataset | Set_04_DMpreB_versus_WTpreB.phenotype_DMpreB_versus_WTpreB.cls #DMpreB_versus_WTpreB |
| Phenotype | phenotype_DMpreB_versus_WTpreB.cls#DMpreB_versus_WTpreB |
| Upregulated in class | WTpreB |
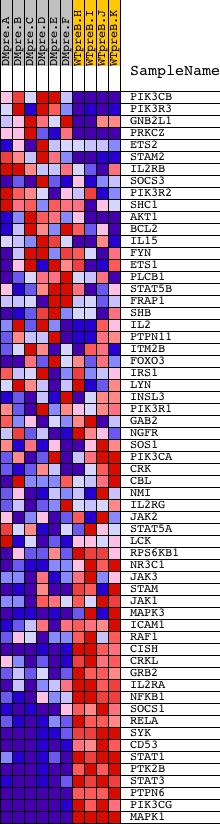
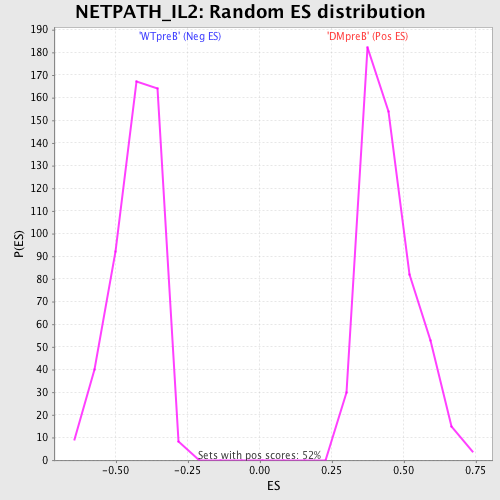
| GeneSet | NETPATH_IL2 |
| Enrichment Score (ES) | -0.72728723 |
| Normalized Enrichment Score (NES) | -1.6879814 |
| Nominal p-value | 0.0 |
| FDR q-value | 0.011590672 |
| FWER p-Value | 0.138 |
| PROBE | DESCRIPTION (from dataset) | GENE SYMBOL | GENE_TITLE | RANK IN GENE LIST | RANK METRIC SCORE | RUNNING ES | CORE ENRICHMENT | |
|---|---|---|---|---|---|---|---|---|
| 1 | PIK3CB | 19030 | 626 | 4.520 | 0.0099 | No | ||
| 2 | PIK3R3 | 5248 | 1211 | 2.839 | 0.0059 | No | ||
| 3 | GNB2L1 | 20911 | 2110 | 1.431 | -0.0287 | No | ||
| 4 | PRKCZ | 5260 | 2281 | 1.203 | -0.0262 | No | ||
| 5 | ETS2 | 10716 | 2753 | 0.762 | -0.0443 | No | ||
| 6 | STAM2 | 7095 2845 | 2969 | 0.582 | -0.0502 | No | ||
| 7 | IL2RB | 22219 | 3089 | 0.502 | -0.0518 | No | ||
| 8 | SOCS3 | 20131 | 3325 | 0.381 | -0.0608 | No | ||
| 9 | PIK3R2 | 18850 | 3888 | 0.232 | -0.0888 | No | ||
| 10 | SHC1 | 9813 9812 5430 | 3936 | 0.225 | -0.0892 | No | ||
| 11 | AKT1 | 8568 | 4218 | 0.183 | -0.1026 | No | ||
| 12 | BCL2 | 8651 3928 13864 4435 981 4062 13863 4027 | 4380 | 0.162 | -0.1097 | No | ||
| 13 | IL15 | 18826 3801 | 4605 | 0.140 | -0.1204 | No | ||
| 14 | FYN | 3375 3395 20052 | 5072 | 0.109 | -0.1444 | No | ||
| 15 | ETS1 | 10715 6230 3135 | 5251 | 0.099 | -0.1531 | No | ||
| 16 | PLCB1 | 14832 2821 | 6766 | 0.047 | -0.2342 | No | ||
| 17 | STAT5B | 20222 | 7325 | 0.036 | -0.2640 | No | ||
| 18 | FRAP1 | 2468 15991 | 7625 | 0.031 | -0.2798 | No | ||
| 19 | SHB | 10493 | 7714 | 0.029 | -0.2842 | No | ||
| 20 | IL2 | 15354 | 8580 | 0.017 | -0.3307 | No | ||
| 21 | PTPN11 | 5326 16391 9660 | 9360 | 0.007 | -0.3726 | No | ||
| 22 | ITM2B | 9192 4935 21753 | 9449 | 0.006 | -0.3773 | No | ||
| 23 | FOXO3 | 19782 3402 | 10283 | -0.004 | -0.4221 | No | ||
| 24 | IRS1 | 4925 | 10290 | -0.005 | -0.4224 | No | ||
| 25 | LYN | 16281 | 10463 | -0.007 | -0.4316 | No | ||
| 26 | INSL3 | 9181 | 10755 | -0.011 | -0.4472 | No | ||
| 27 | PIK3R1 | 3170 | 12502 | -0.041 | -0.5409 | No | ||
| 28 | GAB2 | 1821 18184 2025 | 12548 | -0.043 | -0.5429 | No | ||
| 29 | NGFR | 5174 | 12928 | -0.052 | -0.5628 | No | ||
| 30 | SOS1 | 5476 | 13046 | -0.056 | -0.5686 | No | ||
| 31 | PIK3CA | 9562 | 13540 | -0.075 | -0.5944 | No | ||
| 32 | CRK | 4559 1249 | 14137 | -0.112 | -0.6255 | No | ||
| 33 | CBL | 19154 | 14602 | -0.166 | -0.6489 | No | ||
| 34 | NMI | 14590 | 14649 | -0.174 | -0.6497 | No | ||
| 35 | IL2RG | 24096 | 14876 | -0.214 | -0.6598 | No | ||
| 36 | JAK2 | 23893 9197 3706 | 15111 | -0.267 | -0.6698 | No | ||
| 37 | STAT5A | 20664 | 15113 | -0.268 | -0.6673 | No | ||
| 38 | LCK | 15746 | 15440 | -0.368 | -0.6813 | No | ||
| 39 | RPS6KB1 | 7815 1207 13040 | 15722 | -0.503 | -0.6916 | No | ||
| 40 | NR3C1 | 9043 | 15983 | -0.698 | -0.6989 | No | ||
| 41 | JAK3 | 9198 4936 | 16361 | -1.051 | -0.7090 | No | ||
| 42 | STAM | 2912 15117 | 16701 | -1.509 | -0.7127 | Yes | ||
| 43 | JAK1 | 15827 | 16753 | -1.590 | -0.7001 | Yes | ||
| 44 | MAPK3 | 6458 11170 | 16931 | -1.809 | -0.6922 | Yes | ||
| 45 | ICAM1 | 19545 | 17130 | -2.122 | -0.6823 | Yes | ||
| 46 | RAF1 | 17035 | 17131 | -2.125 | -0.6618 | Yes | ||
| 47 | CISH | 8743 | 17238 | -2.298 | -0.6453 | Yes | ||
| 48 | CRKL | 4560 | 17588 | -3.053 | -0.6347 | Yes | ||
| 49 | GRB2 | 20149 | 17590 | -3.055 | -0.6052 | Yes | ||
| 50 | IL2RA | 4918 | 17622 | -3.145 | -0.5765 | Yes | ||
| 51 | NFKB1 | 15160 | 17789 | -3.591 | -0.5507 | Yes | ||
| 52 | SOCS1 | 4522 | 17793 | -3.598 | -0.5162 | Yes | ||
| 53 | RELA | 23783 | 17959 | -4.092 | -0.4855 | Yes | ||
| 54 | SYK | 21636 | 18074 | -4.548 | -0.4477 | Yes | ||
| 55 | CD53 | 4500 | 18277 | -5.393 | -0.4065 | Yes | ||
| 56 | STAT1 | 3936 5524 | 18294 | -5.505 | -0.3542 | Yes | ||
| 57 | PTK2B | 21776 | 18298 | -5.513 | -0.3011 | Yes | ||
| 58 | STAT3 | 5525 9906 | 18455 | -6.760 | -0.2442 | Yes | ||
| 59 | PTPN6 | 17002 | 18561 | -8.216 | -0.1705 | Yes | ||
| 60 | PIK3CG | 6635 | 18583 | -8.846 | -0.0862 | Yes | ||
| 61 | MAPK1 | 1642 11167 | 18592 | -9.104 | 0.0013 | Yes |