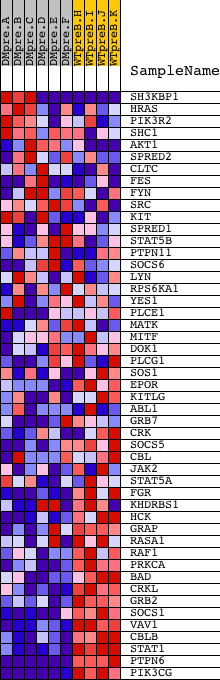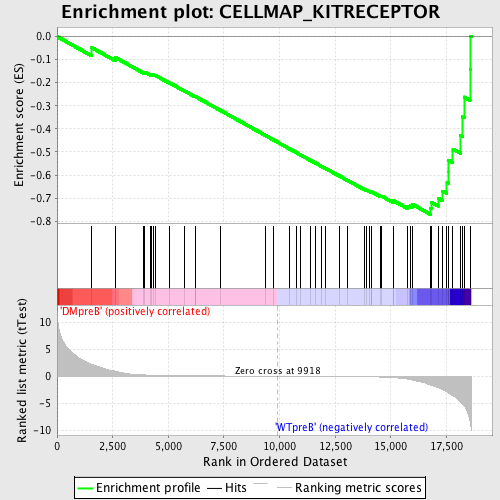
Profile of the Running ES Score & Positions of GeneSet Members on the Rank Ordered List
| Dataset | Set_04_DMpreB_versus_WTpreB.phenotype_DMpreB_versus_WTpreB.cls #DMpreB_versus_WTpreB |
| Phenotype | phenotype_DMpreB_versus_WTpreB.cls#DMpreB_versus_WTpreB |
| Upregulated in class | WTpreB |
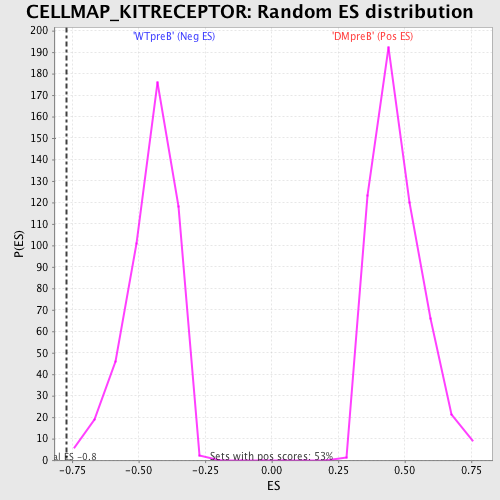
| GeneSet | CELLMAP_KITRECEPTOR |
| Enrichment Score (ES) | -0.77107656 |
| Normalized Enrichment Score (NES) | -1.7056319 |
| Nominal p-value | 0.0021367522 |
| FDR q-value | 0.010553719 |
| FWER p-Value | 0.098 |
| PROBE | DESCRIPTION (from dataset) | GENE SYMBOL | GENE_TITLE | RANK IN GENE LIST | RANK METRIC SCORE | RUNNING ES | CORE ENRICHMENT | |
|---|---|---|---|---|---|---|---|---|
| 1 | SH3KBP1 | 2631 12206 7189 | 1557 | 2.182 | -0.0481 | No | ||
| 2 | HRAS | 4868 | 2610 | 0.906 | -0.0900 | No | ||
| 3 | PIK3R2 | 18850 | 3888 | 0.232 | -0.1549 | No | ||
| 4 | SHC1 | 9813 9812 5430 | 3936 | 0.225 | -0.1538 | No | ||
| 5 | AKT1 | 8568 | 4218 | 0.183 | -0.1659 | No | ||
| 6 | SPRED2 | 8539 4332 | 4238 | 0.180 | -0.1640 | No | ||
| 7 | CLTC | 14610 | 4335 | 0.168 | -0.1664 | No | ||
| 8 | FES | 17779 3949 | 4400 | 0.160 | -0.1673 | No | ||
| 9 | FYN | 3375 3395 20052 | 5072 | 0.109 | -0.2016 | No | ||
| 10 | SRC | 5507 | 5727 | 0.076 | -0.2356 | No | ||
| 11 | KIT | 16823 | 6209 | 0.060 | -0.2605 | No | ||
| 12 | SPRED1 | 4331 | 6232 | 0.060 | -0.2607 | No | ||
| 13 | STAT5B | 20222 | 7325 | 0.036 | -0.3190 | No | ||
| 14 | PTPN11 | 5326 16391 9660 | 9360 | 0.007 | -0.4284 | No | ||
| 15 | SOCS6 | 12042 7044 | 9738 | 0.002 | -0.4486 | No | ||
| 16 | LYN | 16281 | 10463 | -0.007 | -0.4875 | No | ||
| 17 | RPS6KA1 | 15725 | 10766 | -0.011 | -0.5036 | No | ||
| 18 | YES1 | 5930 | 10960 | -0.014 | -0.5138 | No | ||
| 19 | PLCE1 | 13156 | 11374 | -0.020 | -0.5357 | No | ||
| 20 | MATK | 3425 19930 | 11601 | -0.023 | -0.5475 | No | ||
| 21 | MITF | 17349 | 11903 | -0.028 | -0.5633 | No | ||
| 22 | DOK1 | 17104 1018 1177 | 12045 | -0.031 | -0.5703 | No | ||
| 23 | PLCG1 | 14753 | 12675 | -0.046 | -0.6035 | No | ||
| 24 | SOS1 | 5476 | 13046 | -0.056 | -0.6225 | No | ||
| 25 | EPOR | 19204 | 13811 | -0.089 | -0.6622 | No | ||
| 26 | KITLG | 19889 3342 | 13917 | -0.096 | -0.6662 | No | ||
| 27 | ABL1 | 2693 4301 2794 | 14050 | -0.106 | -0.6716 | No | ||
| 28 | GRB7 | 20673 | 14124 | -0.112 | -0.6737 | No | ||
| 29 | CRK | 4559 1249 | 14137 | -0.112 | -0.6725 | No | ||
| 30 | SOCS5 | 1619 23141 | 14532 | -0.155 | -0.6912 | No | ||
| 31 | CBL | 19154 | 14602 | -0.166 | -0.6922 | No | ||
| 32 | JAK2 | 23893 9197 3706 | 15111 | -0.267 | -0.7152 | No | ||
| 33 | STAT5A | 20664 | 15113 | -0.268 | -0.7109 | No | ||
| 34 | FGR | 4723 | 15758 | -0.526 | -0.7370 | No | ||
| 35 | KHDRBS1 | 5405 9778 | 15864 | -0.607 | -0.7327 | No | ||
| 36 | HCK | 14787 | 15979 | -0.695 | -0.7275 | No | ||
| 37 | GRAP | 20851 | 16790 | -1.654 | -0.7440 | Yes | ||
| 38 | RASA1 | 10174 | 16815 | -1.689 | -0.7177 | Yes | ||
| 39 | RAF1 | 17035 | 17131 | -2.125 | -0.6998 | Yes | ||
| 40 | PRKCA | 20174 | 17337 | -2.525 | -0.6696 | Yes | ||
| 41 | BAD | 24000 | 17524 | -2.914 | -0.6319 | Yes | ||
| 42 | CRKL | 4560 | 17588 | -3.053 | -0.5853 | Yes | ||
| 43 | GRB2 | 20149 | 17590 | -3.055 | -0.5354 | Yes | ||
| 44 | SOCS1 | 4522 | 17793 | -3.598 | -0.4874 | Yes | ||
| 45 | VAV1 | 23173 | 18136 | -4.751 | -0.4281 | Yes | ||
| 46 | CBLB | 5531 22734 | 18225 | -5.154 | -0.3484 | Yes | ||
| 47 | STAT1 | 3936 5524 | 18294 | -5.505 | -0.2620 | Yes | ||
| 48 | PTPN6 | 17002 | 18561 | -8.216 | -0.1419 | Yes | ||
| 49 | PIK3CG | 6635 | 18583 | -8.846 | 0.0018 | Yes |