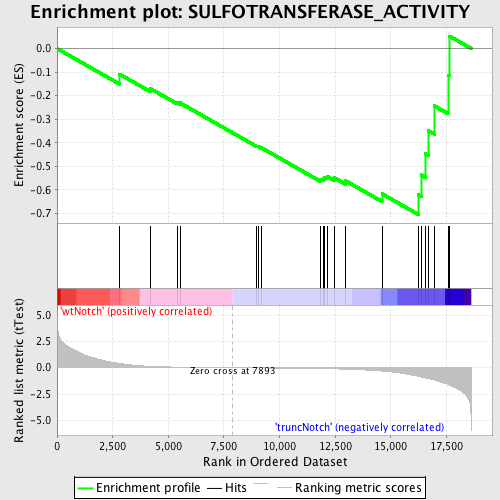
Profile of the Running ES Score & Positions of GeneSet Members on the Rank Ordered List
| Dataset | Set_03_truncNotch_versus_wtNotch.phenotype_truncNotch_versus_wtNotch.cls #wtNotch_versus_truncNotch.phenotype_truncNotch_versus_wtNotch.cls #wtNotch_versus_truncNotch_repos |
| Phenotype | phenotype_truncNotch_versus_wtNotch.cls#wtNotch_versus_truncNotch_repos |
| Upregulated in class | truncNotch |
| GeneSet | SULFOTRANSFERASE_ACTIVITY |
| Enrichment Score (ES) | -0.7039068 |
| Normalized Enrichment Score (NES) | -1.5014651 |
| Nominal p-value | 0.022364218 |
| FDR q-value | 0.5962799 |
| FWER p-Value | 1.0 |

| PROBE | DESCRIPTION (from dataset) | GENE SYMBOL | GENE_TITLE | RANK IN GENE LIST | RANK METRIC SCORE | RUNNING ES | CORE ENRICHMENT | |
|---|---|---|---|---|---|---|---|---|
| 1 | TPST1 | 2570358 | 2800 | 0.409 | -0.1084 | No | ||
| 2 | CHST5 | 6900600 | 4195 | 0.127 | -0.1702 | No | ||
| 3 | UST | 2100053 | 5398 | 0.056 | -0.2290 | No | ||
| 4 | GAL3ST1 | 5080746 | 5523 | 0.052 | -0.2304 | No | ||
| 5 | SULT1E1 | 3140372 | 8979 | -0.018 | -0.4143 | No | ||
| 6 | HS3ST6 | 1780044 | 9032 | -0.019 | -0.4151 | No | ||
| 7 | CHST3 | 2370131 | 9178 | -0.021 | -0.4207 | No | ||
| 8 | CHST4 | 1190008 | 11823 | -0.084 | -0.5543 | No | ||
| 9 | CHST9 | 4560092 | 11963 | -0.089 | -0.5526 | No | ||
| 10 | CHST8 | 1940050 | 12020 | -0.091 | -0.5462 | No | ||
| 11 | HS3ST3B1 | 380040 | 12146 | -0.096 | -0.5429 | No | ||
| 12 | SULT1C2 | 1740348 5910538 | 12455 | -0.111 | -0.5481 | No | ||
| 13 | CHST11 | 6760546 | 12967 | -0.140 | -0.5611 | No | ||
| 14 | CHST7 | 2760066 | 14605 | -0.318 | -0.6163 | No | ||
| 15 | CHST1 | 50601 | 16236 | -0.815 | -0.6198 | Yes | ||
| 16 | CHST2 | 3180682 | 16367 | -0.876 | -0.5363 | Yes | ||
| 17 | CHST10 | 520114 | 16550 | -0.966 | -0.4463 | Yes | ||
| 18 | TPST2 | 6420458 | 16687 | -1.014 | -0.3488 | Yes | ||
| 19 | SULT2B1 | 3360484 4810181 | 16950 | -1.163 | -0.2428 | Yes | ||
| 20 | CHST12 | 2030438 | 17572 | -1.584 | -0.1126 | Yes | ||
| 21 | HS6ST1 | 4760373 | 17635 | -1.633 | 0.0528 | Yes |

