Profile of the Running ES Score & Positions of GeneSet Members on the Rank Ordered List
| Dataset | Set_03_truncNotch_versus_wtNotch.phenotype_truncNotch_versus_wtNotch.cls #wtNotch_versus_truncNotch.phenotype_truncNotch_versus_wtNotch.cls #wtNotch_versus_truncNotch_repos |
| Phenotype | phenotype_truncNotch_versus_wtNotch.cls#wtNotch_versus_truncNotch_repos |
| Upregulated in class | truncNotch |
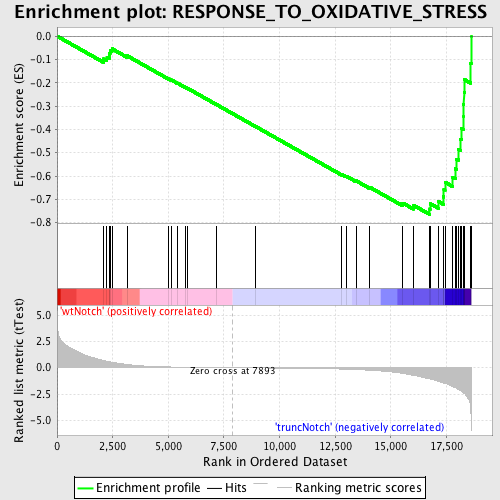
| GeneSet | RESPONSE_TO_OXIDATIVE_STRESS |
| Enrichment Score (ES) | -0.7650183 |
| Normalized Enrichment Score (NES) | -1.8488736 |
| Nominal p-value | 0.0 |
| FDR q-value | 0.0052064075 |
| FWER p-Value | 0.0060 |
| PROBE | DESCRIPTION (from dataset) | GENE SYMBOL | GENE_TITLE | RANK IN GENE LIST | RANK METRIC SCORE | RUNNING ES | CORE ENRICHMENT | |
|---|---|---|---|---|---|---|---|---|
| 1 | CYGB | 870347 | 2097 | 0.672 | -0.0977 | No | ||
| 2 | GCLM | 4230270 | 2241 | 0.605 | -0.0917 | No | ||
| 3 | PRNP | 3140687 | 2346 | 0.563 | -0.0846 | No | ||
| 4 | SOD2 | 1410053 | 2354 | 0.560 | -0.0724 | No | ||
| 5 | ERCC3 | 6900008 | 2382 | 0.551 | -0.0614 | No | ||
| 6 | NDUFA6 | 3990348 | 2468 | 0.517 | -0.0543 | No | ||
| 7 | RNF7 | 2030242 | 3151 | 0.298 | -0.0843 | No | ||
| 8 | NDUFB4 | 460348 5690594 | 5020 | 0.072 | -0.1832 | No | ||
| 9 | GCLC | 2810731 | 5135 | 0.067 | -0.1878 | No | ||
| 10 | APOA4 | 4120451 | 5402 | 0.056 | -0.2009 | No | ||
| 11 | ATOX1 | 1090497 | 5765 | 0.043 | -0.2194 | No | ||
| 12 | SRXN1 | 630731 3130195 4480239 | 5877 | 0.040 | -0.2245 | No | ||
| 13 | SGK2 | 1850070 | 7156 | 0.012 | -0.2930 | No | ||
| 14 | SEPP1 | 450273 | 8914 | -0.017 | -0.3872 | No | ||
| 15 | GLRX2 | 940433 | 12794 | -0.129 | -0.5930 | No | ||
| 16 | PRDX6 | 4920397 6380601 | 13000 | -0.142 | -0.6009 | No | ||
| 17 | MSRA | 4570411 | 13434 | -0.175 | -0.6202 | No | ||
| 18 | SOD1 | 5890070 | 14062 | -0.237 | -0.6486 | No | ||
| 19 | NUDT1 | 2850600 | 15534 | -0.534 | -0.7158 | No | ||
| 20 | APTX | 3360041 4560167 | 16017 | -0.722 | -0.7254 | No | ||
| 21 | MPO | 2360176 2760440 5690176 | 16754 | -1.045 | -0.7414 | Yes | ||
| 22 | TXNRD2 | 2510398 3780451 | 16765 | -1.053 | -0.7182 | Yes | ||
| 23 | GSS | 6130465 6900398 | 17138 | -1.284 | -0.7093 | Yes | ||
| 24 | NDUFS8 | 4150100 | 17361 | -1.430 | -0.6889 | Yes | ||
| 25 | CCL5 | 3710397 | 17387 | -1.453 | -0.6575 | Yes | ||
| 26 | DHCR24 | 840600 1050672 6290097 | 17438 | -1.483 | -0.6267 | Yes | ||
| 27 | NDUFS2 | 4850020 6200402 | 17779 | -1.771 | -0.6050 | Yes | ||
| 28 | ERCC2 | 2360750 4060390 6550138 | 17904 | -1.897 | -0.5689 | Yes | ||
| 29 | PRDX2 | 6760095 4010619 5340577 | 17956 | -1.957 | -0.5275 | Yes | ||
| 30 | PRDX5 | 1660592 2030091 | 18035 | -2.035 | -0.4858 | Yes | ||
| 31 | ERCC1 | 3800010 4590132 4670397 | 18123 | -2.149 | -0.4419 | Yes | ||
| 32 | PDLIM1 | 450100 | 18182 | -2.210 | -0.3952 | Yes | ||
| 33 | PNKP | 4610685 5720605 | 18253 | -2.346 | -0.3460 | Yes | ||
| 34 | GPX3 | 1340450 | 18260 | -2.360 | -0.2931 | Yes | ||
| 35 | SCARA3 | 5890487 | 18289 | -2.403 | -0.2404 | Yes | ||
| 36 | STK25 | 1090519 1500193 | 18311 | -2.438 | -0.1865 | Yes | ||
| 37 | DUSP1 | 6860121 | 18587 | -3.727 | -0.1172 | Yes | ||
| 38 | ERCC8 | 1240300 6450372 6590180 | 18612 | -5.260 | 0.0002 | Yes |

