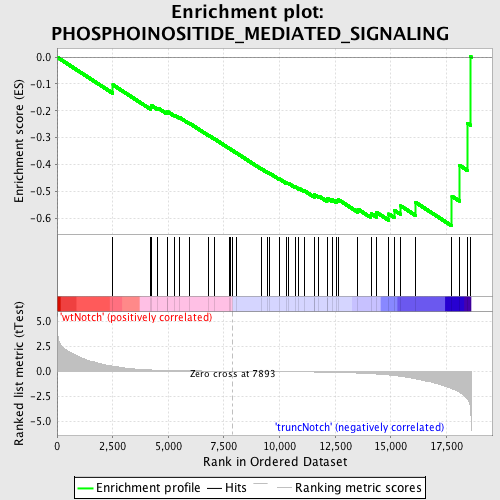
Profile of the Running ES Score & Positions of GeneSet Members on the Rank Ordered List
| Dataset | Set_03_truncNotch_versus_wtNotch.phenotype_truncNotch_versus_wtNotch.cls #wtNotch_versus_truncNotch.phenotype_truncNotch_versus_wtNotch.cls #wtNotch_versus_truncNotch_repos |
| Phenotype | phenotype_truncNotch_versus_wtNotch.cls#wtNotch_versus_truncNotch_repos |
| Upregulated in class | truncNotch |
| GeneSet | PHOSPHOINOSITIDE_MEDIATED_SIGNALING |
| Enrichment Score (ES) | -0.62914014 |
| Normalized Enrichment Score (NES) | -1.5186782 |
| Nominal p-value | 0.018242123 |
| FDR q-value | 0.5815193 |
| FWER p-Value | 1.0 |
| PROBE | DESCRIPTION (from dataset) | GENE SYMBOL | GENE_TITLE | RANK IN GENE LIST | RANK METRIC SCORE | RUNNING ES | CORE ENRICHMENT | |
|---|---|---|---|---|---|---|---|---|
| 1 | P2RY2 | 2640180 2810128 | 2510 | 0.501 | -0.1032 | No | ||
| 2 | NMUR2 | 1580717 | 4215 | 0.126 | -0.1870 | No | ||
| 3 | CCKAR | 4210079 | 4228 | 0.125 | -0.1796 | No | ||
| 4 | PLCB2 | 360132 | 4530 | 0.100 | -0.1895 | No | ||
| 5 | AVPR1A | 2120300 | 4939 | 0.076 | -0.2066 | No | ||
| 6 | EDN2 | 6760647 | 4940 | 0.076 | -0.2018 | No | ||
| 7 | PRKD3 | 5220520 5890519 | 5270 | 0.061 | -0.2156 | No | ||
| 8 | MC3R | 3290538 | 5492 | 0.053 | -0.2242 | No | ||
| 9 | GAP43 | 3130504 | 5951 | 0.038 | -0.2464 | No | ||
| 10 | IL8RB | 450592 1170537 | 6814 | 0.019 | -0.2916 | No | ||
| 11 | NMUR1 | 1500403 | 7075 | 0.013 | -0.3048 | No | ||
| 12 | C5AR1 | 4540402 | 7746 | 0.002 | -0.3407 | No | ||
| 13 | DRD1 | 430025 | 7810 | 0.001 | -0.3440 | No | ||
| 14 | TACR1 | 70358 3840411 | 7875 | 0.000 | -0.3474 | No | ||
| 15 | CHRM1 | 4280619 | 8046 | -0.003 | -0.3564 | No | ||
| 16 | AVPR1B | 1190707 | 9188 | -0.021 | -0.4164 | No | ||
| 17 | CALCA | 5860167 | 9451 | -0.026 | -0.4289 | No | ||
| 18 | PLCE1 | 4780685 | 9551 | -0.028 | -0.4325 | No | ||
| 19 | HOMER1 | 360131 1690092 1990300 4590068 | 9988 | -0.036 | -0.4537 | No | ||
| 20 | NMBR | 6180315 | 10316 | -0.042 | -0.4686 | No | ||
| 21 | EDG2 | 6290215 | 10390 | -0.044 | -0.4697 | No | ||
| 22 | HRH1 | 840100 | 10698 | -0.051 | -0.4830 | No | ||
| 23 | P2RY4 | 630053 | 10864 | -0.055 | -0.4883 | No | ||
| 24 | DRD2 | 5890369 | 11100 | -0.061 | -0.4971 | No | ||
| 25 | CHRM2 | 870750 | 11556 | -0.075 | -0.5168 | No | ||
| 26 | EDNRB | 4280717 6400435 | 11561 | -0.075 | -0.5123 | No | ||
| 27 | CCKBR | 2760128 | 11756 | -0.081 | -0.5176 | No | ||
| 28 | HTR2B | 6510538 | 12132 | -0.096 | -0.5317 | No | ||
| 29 | GRM5 | 60528 | 12137 | -0.096 | -0.5258 | No | ||
| 30 | AGTR1 | 4780524 2680592 | 12362 | -0.107 | -0.5310 | No | ||
| 31 | PARD3 | 3390324 5390541 | 12562 | -0.117 | -0.5343 | No | ||
| 32 | P2RY1 | 6040121 | 12644 | -0.121 | -0.5310 | No | ||
| 33 | GNAQ | 430670 4210131 5900736 | 13521 | -0.183 | -0.5665 | No | ||
| 34 | LTB4R | 1770056 | 14108 | -0.243 | -0.5826 | No | ||
| 35 | EGFR | 4920138 6480521 | 14360 | -0.276 | -0.5786 | No | ||
| 36 | GNA15 | 870037 | 14909 | -0.372 | -0.5844 | Yes | ||
| 37 | F2RL3 | 5340010 | 15151 | -0.424 | -0.5704 | Yes | ||
| 38 | PPAP2A | 1170397 3440288 3930270 | 15449 | -0.503 | -0.5544 | Yes | ||
| 39 | EDNRA | 6900133 | 16120 | -0.767 | -0.5416 | Yes | ||
| 40 | EDG6 | 2630121 | 17747 | -1.739 | -0.5185 | Yes | ||
| 41 | EDG4 | 1770097 1780519 | 18083 | -2.100 | -0.4028 | Yes | ||
| 42 | P2RY6 | 5290400 | 18432 | -2.760 | -0.2459 | Yes | ||
| 43 | PICK1 | 3990500 4920500 | 18595 | -4.019 | 0.0011 | Yes |

