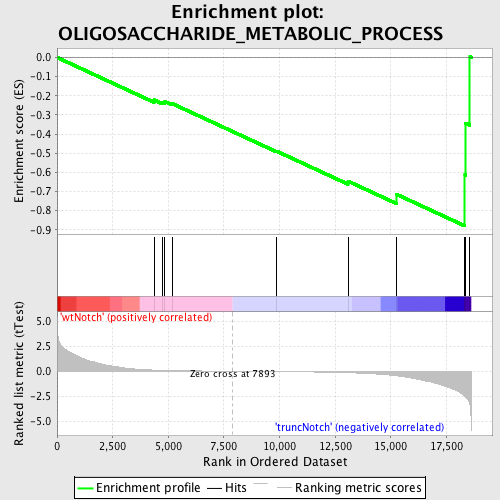
Profile of the Running ES Score & Positions of GeneSet Members on the Rank Ordered List
| Dataset | Set_03_truncNotch_versus_wtNotch.phenotype_truncNotch_versus_wtNotch.cls #wtNotch_versus_truncNotch.phenotype_truncNotch_versus_wtNotch.cls #wtNotch_versus_truncNotch_repos |
| Phenotype | phenotype_truncNotch_versus_wtNotch.cls#wtNotch_versus_truncNotch_repos |
| Upregulated in class | truncNotch |
| GeneSet | OLIGOSACCHARIDE_METABOLIC_PROCESS |
| Enrichment Score (ES) | -0.8798908 |
| Normalized Enrichment Score (NES) | -1.5600884 |
| Nominal p-value | 0.0036101083 |
| FDR q-value | 0.7001965 |
| FWER p-Value | 0.992 |
| PROBE | DESCRIPTION (from dataset) | GENE SYMBOL | GENE_TITLE | RANK IN GENE LIST | RANK METRIC SCORE | RUNNING ES | CORE ENRICHMENT | |
|---|---|---|---|---|---|---|---|---|
| 1 | ST8SIA3 | 6940427 | 4357 | 0.114 | -0.2219 | No | ||
| 2 | GLA | 4610364 | 4744 | 0.086 | -0.2334 | No | ||
| 3 | ST8SIA4 | 2680605 3060215 | 4845 | 0.080 | -0.2302 | No | ||
| 4 | FUT8 | 1340068 2340056 | 5180 | 0.065 | -0.2412 | No | ||
| 5 | ST6GAL2 | 1170739 | 9869 | -0.033 | -0.4895 | No | ||
| 6 | ST8SIA2 | 2680082 | 13076 | -0.147 | -0.6460 | No | ||
| 7 | COG2 | 5900129 | 15265 | -0.451 | -0.7151 | Yes | ||
| 8 | B4GALT1 | 6980167 | 18332 | -2.483 | -0.6130 | Yes | ||
| 9 | MPDU1 | 1850091 | 18356 | -2.528 | -0.3426 | Yes | ||
| 10 | ST6GAL1 | 2970546 | 18557 | -3.317 | 0.0032 | Yes |

