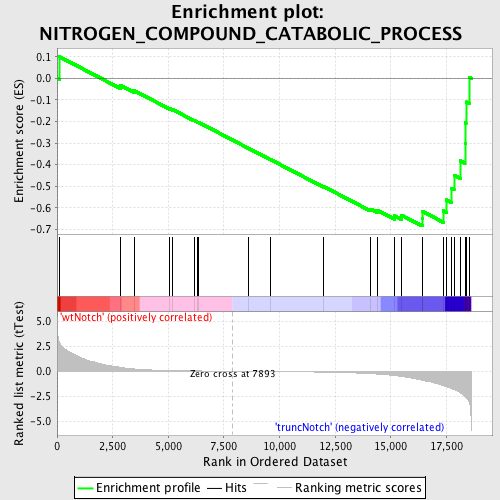
Profile of the Running ES Score & Positions of GeneSet Members on the Rank Ordered List
| Dataset | Set_03_truncNotch_versus_wtNotch.phenotype_truncNotch_versus_wtNotch.cls #wtNotch_versus_truncNotch.phenotype_truncNotch_versus_wtNotch.cls #wtNotch_versus_truncNotch_repos |
| Phenotype | phenotype_truncNotch_versus_wtNotch.cls#wtNotch_versus_truncNotch_repos |
| Upregulated in class | truncNotch |
| GeneSet | NITROGEN_COMPOUND_CATABOLIC_PROCESS |
| Enrichment Score (ES) | -0.68411404 |
| Normalized Enrichment Score (NES) | -1.5222731 |
| Nominal p-value | 0.017361112 |
| FDR q-value | 0.6020645 |
| FWER p-Value | 1.0 |
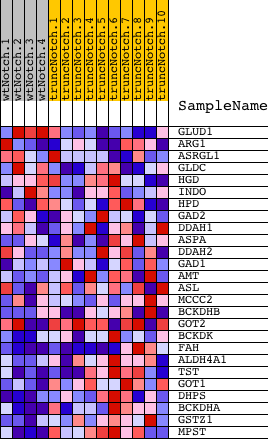
| PROBE | DESCRIPTION (from dataset) | GENE SYMBOL | GENE_TITLE | RANK IN GENE LIST | RANK METRIC SCORE | RUNNING ES | CORE ENRICHMENT | |
|---|---|---|---|---|---|---|---|---|
| 1 | GLUD1 | 4210372 | 117 | 2.811 | 0.0995 | No | ||
| 2 | ARG1 | 840707 | 2838 | 0.392 | -0.0320 | No | ||
| 3 | ASRGL1 | 6620278 | 3467 | 0.231 | -0.0571 | No | ||
| 4 | GLDC | 1170324 | 5073 | 0.070 | -0.1408 | No | ||
| 5 | HGD | 460390 | 5205 | 0.064 | -0.1455 | No | ||
| 6 | INDO | 2680390 | 6170 | 0.033 | -0.1961 | No | ||
| 7 | HPD | 3120519 | 6323 | 0.029 | -0.2032 | No | ||
| 8 | GAD2 | 1400088 | 6361 | 0.028 | -0.2041 | No | ||
| 9 | DDAH1 | 6400750 | 8602 | -0.012 | -0.3241 | No | ||
| 10 | ASPA | 3290400 | 9578 | -0.028 | -0.3755 | No | ||
| 11 | DDAH2 | 4480551 | 11984 | -0.090 | -0.5015 | No | ||
| 12 | GAD1 | 2360035 3140167 | 14087 | -0.240 | -0.6055 | No | ||
| 13 | AMT | 3180450 | 14400 | -0.282 | -0.6117 | No | ||
| 14 | ASL | 1240601 5340309 5360082 | 15172 | -0.429 | -0.6370 | No | ||
| 15 | MCCC2 | 6110168 | 15478 | -0.515 | -0.6340 | No | ||
| 16 | BCKDHB | 780372 | 16410 | -0.898 | -0.6503 | Yes | ||
| 17 | GOT2 | 4570164 5220450 | 16430 | -0.906 | -0.6172 | Yes | ||
| 18 | BCKDK | 1940601 3990600 | 17358 | -1.428 | -0.6133 | Yes | ||
| 19 | FAH | 5390195 | 17498 | -1.525 | -0.5634 | Yes | ||
| 20 | ALDH4A1 | 2450450 | 17714 | -1.712 | -0.5105 | Yes | ||
| 21 | TST | 730372 | 17844 | -1.841 | -0.4481 | Yes | ||
| 22 | GOT1 | 2940465 | 18118 | -2.138 | -0.3823 | Yes | ||
| 23 | DHPS | 5340735 | 18335 | -2.486 | -0.3003 | Yes | ||
| 24 | BCKDHA | 50189 | 18354 | -2.526 | -0.2062 | Yes | ||
| 25 | GSTZ1 | 7000451 | 18383 | -2.608 | -0.1095 | Yes | ||
| 26 | MPST | 6380373 | 18544 | -3.240 | 0.0039 | Yes |