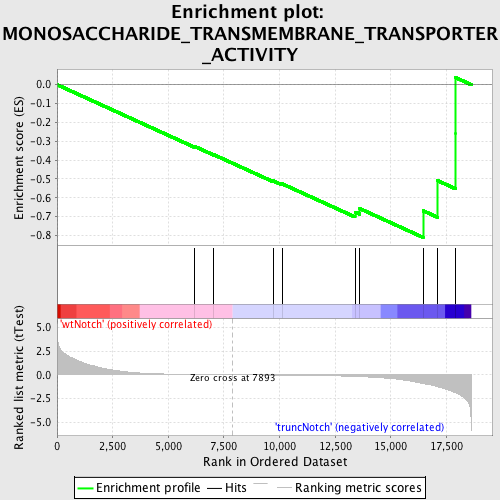
Profile of the Running ES Score & Positions of GeneSet Members on the Rank Ordered List
| Dataset | Set_03_truncNotch_versus_wtNotch.phenotype_truncNotch_versus_wtNotch.cls #wtNotch_versus_truncNotch.phenotype_truncNotch_versus_wtNotch.cls #wtNotch_versus_truncNotch_repos |
| Phenotype | phenotype_truncNotch_versus_wtNotch.cls#wtNotch_versus_truncNotch_repos |
| Upregulated in class | truncNotch |
| GeneSet | MONOSACCHARIDE_TRANSMEMBRANE_TRANSPORTER_ACTIVITY |
| Enrichment Score (ES) | -0.81009305 |
| Normalized Enrichment Score (NES) | -1.4936157 |
| Nominal p-value | 0.02014652 |
| FDR q-value | 0.6184352 |
| FWER p-Value | 1.0 |

| PROBE | DESCRIPTION (from dataset) | GENE SYMBOL | GENE_TITLE | RANK IN GENE LIST | RANK METRIC SCORE | RUNNING ES | CORE ENRICHMENT | |
|---|---|---|---|---|---|---|---|---|
| 1 | SLC2A2 | 5130537 5720722 6770079 | 6166 | 0.033 | -0.3263 | No | ||
| 2 | SLC2A4 | 540441 | 7047 | 0.014 | -0.3714 | No | ||
| 3 | SLC2A5 | 670273 | 9715 | -0.030 | -0.5101 | No | ||
| 4 | SLC5A1 | 2470053 | 10122 | -0.039 | -0.5259 | No | ||
| 5 | SLC5A2 | 4480148 6400242 | 13391 | -0.171 | -0.6751 | Yes | ||
| 6 | PPBP | 5130446 | 13605 | -0.191 | -0.6571 | Yes | ||
| 7 | SLC2A8 | 730039 1190739 2120278 | 16453 | -0.917 | -0.6684 | Yes | ||
| 8 | SLC2A3 | 1990377 | 17099 | -1.258 | -0.5085 | Yes | ||
| 9 | SLC2A1 | 2100609 | 17911 | -1.907 | -0.2573 | Yes | ||
| 10 | SLC37A4 | 6400079 | 17914 | -1.909 | 0.0377 | Yes |

