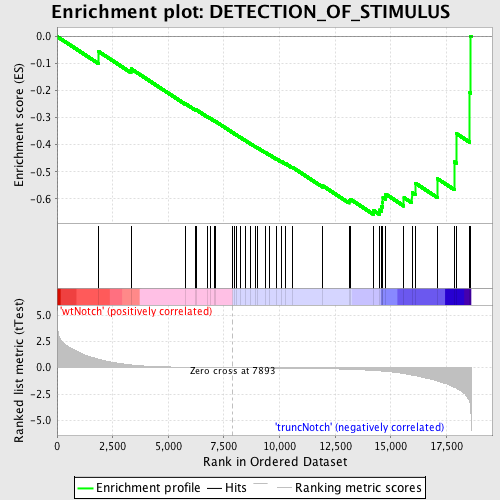
Profile of the Running ES Score & Positions of GeneSet Members on the Rank Ordered List
| Dataset | Set_03_truncNotch_versus_wtNotch.phenotype_truncNotch_versus_wtNotch.cls #wtNotch_versus_truncNotch.phenotype_truncNotch_versus_wtNotch.cls #wtNotch_versus_truncNotch_repos |
| Phenotype | phenotype_truncNotch_versus_wtNotch.cls#wtNotch_versus_truncNotch_repos |
| Upregulated in class | truncNotch |
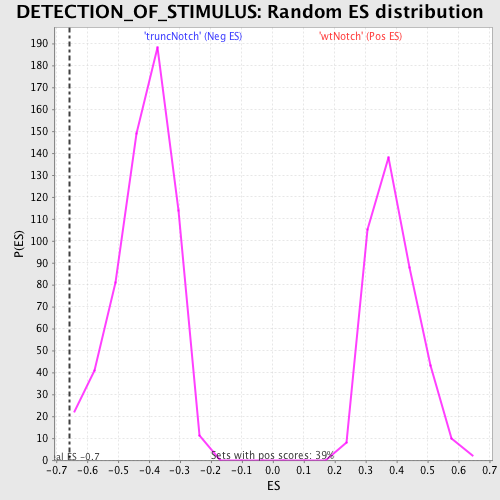
| GeneSet | DETECTION_OF_STIMULUS |
| Enrichment Score (ES) | -0.6579868 |
| Normalized Enrichment Score (NES) | -1.584744 |
| Nominal p-value | 0.0033003301 |
| FDR q-value | 0.56606567 |
| FWER p-Value | 0.957 |
| PROBE | DESCRIPTION (from dataset) | GENE SYMBOL | GENE_TITLE | RANK IN GENE LIST | RANK METRIC SCORE | RUNNING ES | CORE ENRICHMENT | |
|---|---|---|---|---|---|---|---|---|
| 1 | CADM1 | 6620128 | 1864 | 0.806 | -0.0554 | No | ||
| 2 | NOD2 | 2510050 | 3324 | 0.261 | -0.1194 | No | ||
| 3 | TAC1 | 7000195 380706 | 5769 | 0.043 | -0.2485 | No | ||
| 4 | KCNIP2 | 60088 1780324 | 6230 | 0.031 | -0.2715 | No | ||
| 5 | OPN1SW | 6420377 | 6245 | 0.031 | -0.2705 | No | ||
| 6 | KCNMB2 | 3780128 4760136 | 6747 | 0.020 | -0.2964 | No | ||
| 7 | NLRC4 | 5570332 | 6898 | 0.017 | -0.3035 | No | ||
| 8 | NR2E3 | 7050465 | 7089 | 0.013 | -0.3130 | No | ||
| 9 | OPN4 | 5670091 | 7123 | 0.013 | -0.3141 | No | ||
| 10 | TACR1 | 70358 3840411 | 7875 | 0.000 | -0.3545 | No | ||
| 11 | CRTAM | 4480110 | 7989 | -0.002 | -0.3605 | No | ||
| 12 | TAS1R2 | 4850072 | 8082 | -0.003 | -0.3653 | No | ||
| 13 | TAS1R3 | 360136 | 8247 | -0.006 | -0.3738 | No | ||
| 14 | PGLYRP3 | 6350403 | 8455 | -0.009 | -0.3844 | No | ||
| 15 | PDE6B | 2480187 | 8702 | -0.013 | -0.3969 | No | ||
| 16 | TRPC3 | 840064 | 8917 | -0.017 | -0.4075 | No | ||
| 17 | GRK1 | 1410112 | 9024 | -0.019 | -0.4122 | No | ||
| 18 | NPFFR2 | 2320273 | 9357 | -0.024 | -0.4287 | No | ||
| 19 | SYT1 | 840364 | 9554 | -0.028 | -0.4377 | No | ||
| 20 | NLRP3 | 1980064 4010180 | 9868 | -0.033 | -0.4527 | No | ||
| 21 | TIMELESS | 3710315 | 10080 | -0.038 | -0.4619 | No | ||
| 22 | CASR | 610504 | 10263 | -0.041 | -0.4694 | No | ||
| 23 | GCK | 2370273 | 10568 | -0.048 | -0.4831 | No | ||
| 24 | RTP3 | 2260176 | 11937 | -0.088 | -0.5518 | No | ||
| 25 | KCNIP1 | 6370736 | 13122 | -0.151 | -0.6071 | No | ||
| 26 | ABCA4 | 2370064 3940711 | 13169 | -0.154 | -0.6010 | No | ||
| 27 | UGT2A1 | 5080338 | 14220 | -0.259 | -0.6431 | Yes | ||
| 28 | GRM6 | 2030398 | 14498 | -0.299 | -0.6413 | Yes | ||
| 29 | PDC | 3140400 3780184 | 14586 | -0.315 | -0.6284 | Yes | ||
| 30 | RHO | 4280398 | 14630 | -0.323 | -0.6127 | Yes | ||
| 31 | CACNA1F | 2360605 3390450 | 14646 | -0.325 | -0.5954 | Yes | ||
| 32 | SAG | 6550603 | 14774 | -0.346 | -0.5829 | Yes | ||
| 33 | KCNMB4 | 3290347 | 15591 | -0.554 | -0.5959 | Yes | ||
| 34 | STIM1 | 6380138 | 15951 | -0.692 | -0.5766 | Yes | ||
| 35 | PGLYRP4 | 3780411 | 16110 | -0.763 | -0.5426 | Yes | ||
| 36 | PGLYRP1 | 6760242 | 17089 | -1.254 | -0.5253 | Yes | ||
| 37 | PITPNM1 | 4540528 | 17856 | -1.847 | -0.4635 | Yes | ||
| 38 | UNC119 | 360372 | 17959 | -1.963 | -0.3595 | Yes | ||
| 39 | NOD1 | 2360368 | 18550 | -3.288 | -0.2079 | Yes | ||
| 40 | PGLYRP2 | 2340086 | 18589 | -3.791 | 0.0015 | Yes |