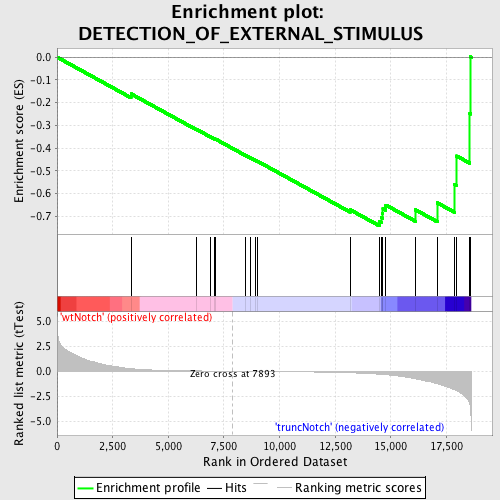
Profile of the Running ES Score & Positions of GeneSet Members on the Rank Ordered List
| Dataset | Set_03_truncNotch_versus_wtNotch.phenotype_truncNotch_versus_wtNotch.cls #wtNotch_versus_truncNotch.phenotype_truncNotch_versus_wtNotch.cls #wtNotch_versus_truncNotch_repos |
| Phenotype | phenotype_truncNotch_versus_wtNotch.cls#wtNotch_versus_truncNotch_repos |
| Upregulated in class | truncNotch |
| GeneSet | DETECTION_OF_EXTERNAL_STIMULUS |
| Enrichment Score (ES) | -0.7427705 |
| Normalized Enrichment Score (NES) | -1.5945417 |
| Nominal p-value | 0.008992806 |
| FDR q-value | 0.8050885 |
| FWER p-Value | 0.941 |
| PROBE | DESCRIPTION (from dataset) | GENE SYMBOL | GENE_TITLE | RANK IN GENE LIST | RANK METRIC SCORE | RUNNING ES | CORE ENRICHMENT | |
|---|---|---|---|---|---|---|---|---|
| 1 | NOD2 | 2510050 | 3324 | 0.261 | -0.1614 | No | ||
| 2 | OPN1SW | 6420377 | 6245 | 0.031 | -0.3164 | No | ||
| 3 | NLRC4 | 5570332 | 6898 | 0.017 | -0.3503 | No | ||
| 4 | NR2E3 | 7050465 | 7089 | 0.013 | -0.3596 | No | ||
| 5 | OPN4 | 5670091 | 7123 | 0.013 | -0.3606 | No | ||
| 6 | PGLYRP3 | 6350403 | 8455 | -0.009 | -0.4316 | No | ||
| 7 | PDE6B | 2480187 | 8702 | -0.013 | -0.4439 | No | ||
| 8 | TRPC3 | 840064 | 8917 | -0.017 | -0.4543 | No | ||
| 9 | GRK1 | 1410112 | 9024 | -0.019 | -0.4588 | No | ||
| 10 | ABCA4 | 2370064 3940711 | 13169 | -0.154 | -0.6714 | No | ||
| 11 | GRM6 | 2030398 | 14498 | -0.299 | -0.7229 | Yes | ||
| 12 | PDC | 3140400 3780184 | 14586 | -0.315 | -0.7067 | Yes | ||
| 13 | RHO | 4280398 | 14630 | -0.323 | -0.6875 | Yes | ||
| 14 | CACNA1F | 2360605 3390450 | 14646 | -0.325 | -0.6667 | Yes | ||
| 15 | SAG | 6550603 | 14774 | -0.346 | -0.6506 | Yes | ||
| 16 | PGLYRP4 | 3780411 | 16110 | -0.763 | -0.6717 | Yes | ||
| 17 | PGLYRP1 | 6760242 | 17089 | -1.254 | -0.6411 | Yes | ||
| 18 | PITPNM1 | 4540528 | 17856 | -1.847 | -0.5596 | Yes | ||
| 19 | UNC119 | 360372 | 17959 | -1.963 | -0.4348 | Yes | ||
| 20 | NOD1 | 2360368 | 18550 | -3.288 | -0.2482 | Yes | ||
| 21 | PGLYRP2 | 2340086 | 18589 | -3.791 | 0.0015 | Yes |

