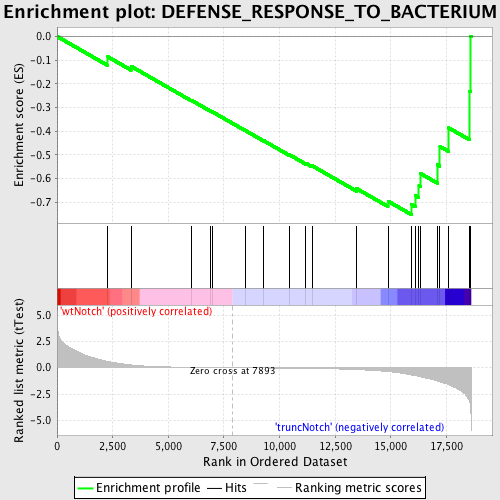
Profile of the Running ES Score & Positions of GeneSet Members on the Rank Ordered List
| Dataset | Set_03_truncNotch_versus_wtNotch.phenotype_truncNotch_versus_wtNotch.cls #wtNotch_versus_truncNotch.phenotype_truncNotch_versus_wtNotch.cls #wtNotch_versus_truncNotch_repos |
| Phenotype | phenotype_truncNotch_versus_wtNotch.cls#wtNotch_versus_truncNotch_repos |
| Upregulated in class | truncNotch |
| GeneSet | DEFENSE_RESPONSE_TO_BACTERIUM |
| Enrichment Score (ES) | -0.75136465 |
| Normalized Enrichment Score (NES) | -1.5894445 |
| Nominal p-value | 0.008503402 |
| FDR q-value | 0.66140896 |
| FWER p-Value | 0.951 |
| PROBE | DESCRIPTION (from dataset) | GENE SYMBOL | GENE_TITLE | RANK IN GENE LIST | RANK METRIC SCORE | RUNNING ES | CORE ENRICHMENT | |
|---|---|---|---|---|---|---|---|---|
| 1 | IL12A | 7100551 | 2283 | 0.588 | -0.0862 | No | ||
| 2 | NOD2 | 2510050 | 3324 | 0.261 | -0.1259 | No | ||
| 3 | TLR3 | 6760451 | 6033 | 0.036 | -0.2693 | No | ||
| 4 | NLRC4 | 5570332 | 6898 | 0.017 | -0.3147 | No | ||
| 5 | TLR6 | 510102 3390148 | 7006 | 0.015 | -0.3195 | No | ||
| 6 | PGLYRP3 | 6350403 | 8455 | -0.009 | -0.3968 | No | ||
| 7 | SPACA3 | 1850161 | 9287 | -0.023 | -0.4401 | No | ||
| 8 | DEFB103A | 50014 | 10443 | -0.045 | -0.4993 | No | ||
| 9 | WFDC12 | 6980647 | 11184 | -0.063 | -0.5352 | No | ||
| 10 | LALBA | 6940685 | 11470 | -0.072 | -0.5461 | No | ||
| 11 | DMBT1 | 7050270 | 13468 | -0.178 | -0.6424 | No | ||
| 12 | STAB1 | 5390707 | 14874 | -0.364 | -0.6953 | No | ||
| 13 | STAB2 | 4810452 | 15918 | -0.676 | -0.7093 | Yes | ||
| 14 | PGLYRP4 | 3780411 | 16110 | -0.763 | -0.6721 | Yes | ||
| 15 | DEFB127 | 520564 | 16265 | -0.830 | -0.6288 | Yes | ||
| 16 | CFP | 2100619 | 16342 | -0.868 | -0.5789 | Yes | ||
| 17 | PGLYRP1 | 6760242 | 17089 | -1.254 | -0.5411 | Yes | ||
| 18 | SPN | 3520338 3870671 | 17208 | -1.335 | -0.4644 | Yes | ||
| 19 | CAMP | 6290735 | 17599 | -1.602 | -0.3857 | Yes | ||
| 20 | NOD1 | 2360368 | 18550 | -3.288 | -0.2323 | Yes | ||
| 21 | PGLYRP2 | 2340086 | 18589 | -3.791 | 0.0015 | Yes |

