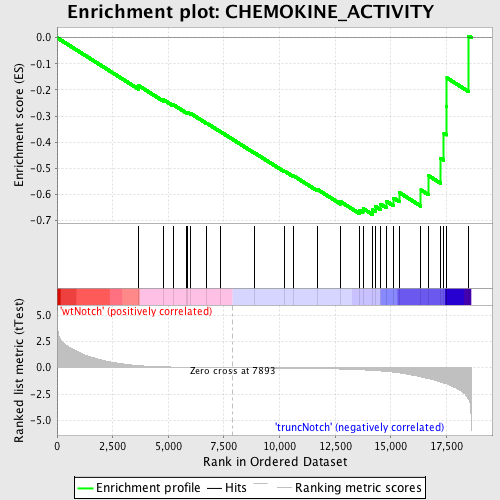
Profile of the Running ES Score & Positions of GeneSet Members on the Rank Ordered List
| Dataset | Set_03_truncNotch_versus_wtNotch.phenotype_truncNotch_versus_wtNotch.cls #wtNotch_versus_truncNotch.phenotype_truncNotch_versus_wtNotch.cls #wtNotch_versus_truncNotch_repos |
| Phenotype | phenotype_truncNotch_versus_wtNotch.cls#wtNotch_versus_truncNotch_repos |
| Upregulated in class | truncNotch |
| GeneSet | CHEMOKINE_ACTIVITY |
| Enrichment Score (ES) | -0.67687386 |
| Normalized Enrichment Score (NES) | -1.5083745 |
| Nominal p-value | 0.015873017 |
| FDR q-value | 0.5766592 |
| FWER p-Value | 1.0 |
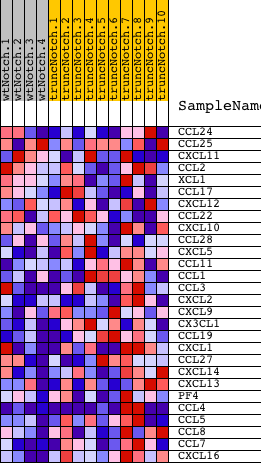
| PROBE | DESCRIPTION (from dataset) | GENE SYMBOL | GENE_TITLE | RANK IN GENE LIST | RANK METRIC SCORE | RUNNING ES | CORE ENRICHMENT | |
|---|---|---|---|---|---|---|---|---|
| 1 | CCL24 | 670129 | 3670 | 0.193 | -0.1837 | No | ||
| 2 | CCL25 | 450541 540435 | 4784 | 0.084 | -0.2376 | No | ||
| 3 | CXCL11 | 1090551 | 5210 | 0.063 | -0.2559 | No | ||
| 4 | CCL2 | 4760019 | 5831 | 0.042 | -0.2863 | No | ||
| 5 | XCL1 | 3800504 | 5859 | 0.041 | -0.2848 | No | ||
| 6 | CCL17 | 630121 | 6016 | 0.036 | -0.2907 | No | ||
| 7 | CXCL12 | 580546 4150750 4570068 | 6718 | 0.020 | -0.3269 | No | ||
| 8 | CCL22 | 6380086 | 7347 | 0.009 | -0.3601 | No | ||
| 9 | CXCL10 | 2450408 | 8852 | -0.016 | -0.4399 | No | ||
| 10 | CCL28 | 2690593 | 10232 | -0.041 | -0.5111 | No | ||
| 11 | CXCL5 | 6370333 | 10633 | -0.050 | -0.5291 | No | ||
| 12 | CCL11 | 1770347 | 11687 | -0.079 | -0.5801 | No | ||
| 13 | CCL1 | 4230167 | 12745 | -0.126 | -0.6280 | No | ||
| 14 | CCL3 | 2810092 | 13593 | -0.190 | -0.6601 | Yes | ||
| 15 | CXCL2 | 610398 | 13750 | -0.205 | -0.6539 | Yes | ||
| 16 | CXCL9 | 1570673 | 14178 | -0.253 | -0.6588 | Yes | ||
| 17 | CX3CL1 | 3990707 | 14317 | -0.272 | -0.6469 | Yes | ||
| 18 | CCL19 | 5080487 | 14540 | -0.306 | -0.6371 | Yes | ||
| 19 | CXCL1 | 2690537 | 14790 | -0.349 | -0.6256 | Yes | ||
| 20 | CCL27 | 2120070 | 15124 | -0.418 | -0.6138 | Yes | ||
| 21 | CXCL14 | 840114 6450324 | 15393 | -0.488 | -0.5935 | Yes | ||
| 22 | CXCL13 | 6290402 | 16355 | -0.873 | -0.5830 | Yes | ||
| 23 | PF4 | 6130332 | 16706 | -1.023 | -0.5290 | Yes | ||
| 24 | CCL4 | 50368 430047 | 17242 | -1.353 | -0.4614 | Yes | ||
| 25 | CCL5 | 3710397 | 17387 | -1.453 | -0.3657 | Yes | ||
| 26 | CCL8 | 3870010 | 17515 | -1.535 | -0.2632 | Yes | ||
| 27 | CCL7 | 2650519 | 17523 | -1.539 | -0.1540 | Yes | ||
| 28 | CXCL16 | 510278 | 18502 | -2.989 | 0.0061 | Yes |