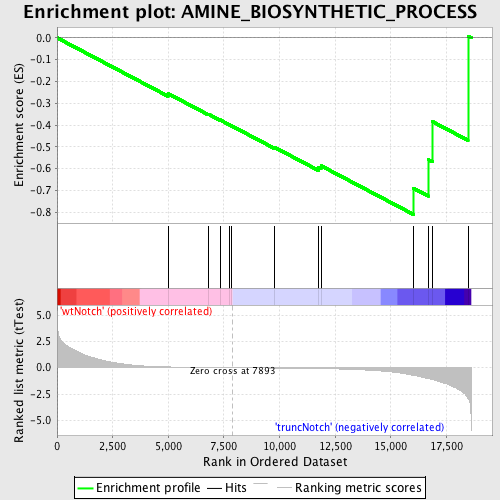
Profile of the Running ES Score & Positions of GeneSet Members on the Rank Ordered List
| Dataset | Set_03_truncNotch_versus_wtNotch.phenotype_truncNotch_versus_wtNotch.cls #wtNotch_versus_truncNotch.phenotype_truncNotch_versus_wtNotch.cls #wtNotch_versus_truncNotch_repos |
| Phenotype | phenotype_truncNotch_versus_wtNotch.cls#wtNotch_versus_truncNotch_repos |
| Upregulated in class | truncNotch |
| GeneSet | AMINE_BIOSYNTHETIC_PROCESS |
| Enrichment Score (ES) | -0.81057996 |
| Normalized Enrichment Score (NES) | -1.5295094 |
| Nominal p-value | 0.019642858 |
| FDR q-value | 0.59177387 |
| FWER p-Value | 1.0 |
| PROBE | DESCRIPTION (from dataset) | GENE SYMBOL | GENE_TITLE | RANK IN GENE LIST | RANK METRIC SCORE | RUNNING ES | CORE ENRICHMENT | |
|---|---|---|---|---|---|---|---|---|
| 1 | PRG3 | 6220020 | 4986 | 0.073 | -0.2558 | No | ||
| 2 | SLC5A7 | 4760091 | 6799 | 0.019 | -0.3501 | No | ||
| 3 | ALDH18A1 | 2340601 | 7323 | 0.009 | -0.3767 | No | ||
| 4 | BBOX1 | 2030538 2370452 | 7747 | 0.002 | -0.3990 | No | ||
| 5 | PAH | 3800309 | 7857 | 0.001 | -0.4047 | No | ||
| 6 | CDO1 | 2480279 | 9790 | -0.032 | -0.5033 | No | ||
| 7 | MAT2B | 1690139 2510706 | 11755 | -0.081 | -0.5955 | No | ||
| 8 | TGFB2 | 4920292 | 11864 | -0.085 | -0.5871 | No | ||
| 9 | OAZ1 | 110181 | 16022 | -0.724 | -0.6908 | Yes | ||
| 10 | PLOD1 | 6040427 | 16680 | -1.011 | -0.5587 | Yes | ||
| 11 | PYCR1 | 6180670 | 16871 | -1.114 | -0.3846 | Yes | ||
| 12 | BCAT1 | 3290128 4050408 | 18470 | -2.890 | 0.0078 | Yes |

