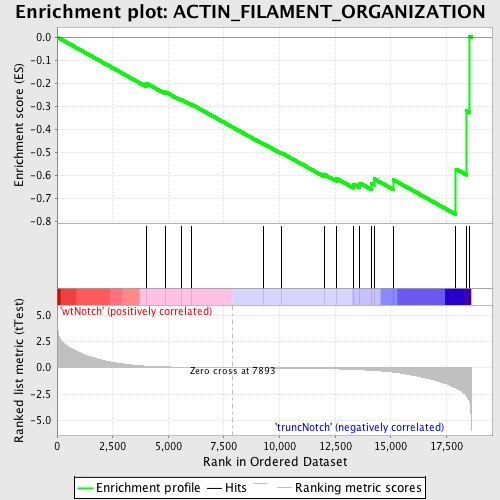
Profile of the Running ES Score & Positions of GeneSet Members on the Rank Ordered List
| Dataset | Set_03_truncNotch_versus_wtNotch.phenotype_truncNotch_versus_wtNotch.cls #wtNotch_versus_truncNotch.phenotype_truncNotch_versus_wtNotch.cls #wtNotch_versus_truncNotch_repos |
| Phenotype | phenotype_truncNotch_versus_wtNotch.cls#wtNotch_versus_truncNotch_repos |
| Upregulated in class | truncNotch |
| GeneSet | ACTIN_FILAMENT_ORGANIZATION |
| Enrichment Score (ES) | -0.77161336 |
| Normalized Enrichment Score (NES) | -1.5468079 |
| Nominal p-value | 0.008445946 |
| FDR q-value | 0.56885225 |
| FWER p-Value | 0.997 |
| PROBE | DESCRIPTION (from dataset) | GENE SYMBOL | GENE_TITLE | RANK IN GENE LIST | RANK METRIC SCORE | RUNNING ES | CORE ENRICHMENT | |
|---|---|---|---|---|---|---|---|---|
| 1 | SORBS3 | 50465 | 4009 | 0.147 | -0.2004 | No | ||
| 2 | PLA2G1B | 460500 | 4874 | 0.079 | -0.2388 | No | ||
| 3 | TSC1 | 1850672 | 5592 | 0.049 | -0.2722 | No | ||
| 4 | NF2 | 4150735 6450139 | 6028 | 0.036 | -0.2919 | No | ||
| 5 | ACTA1 | 840538 | 9285 | -0.023 | -0.4646 | No | ||
| 6 | ARHGEF2 | 3360577 | 10092 | -0.038 | -0.5041 | No | ||
| 7 | DBN1 | 7100537 | 12002 | -0.091 | -0.5974 | No | ||
| 8 | FSCN2 | 1230039 | 12543 | -0.115 | -0.6145 | No | ||
| 9 | RHOF | 4070368 | 13324 | -0.166 | -0.6394 | Yes | ||
| 10 | DLG1 | 2630091 6020286 | 13610 | -0.191 | -0.6351 | Yes | ||
| 11 | BCAR1 | 1340215 | 14147 | -0.249 | -0.6383 | Yes | ||
| 12 | RND1 | 5080300 | 14247 | -0.264 | -0.6165 | Yes | ||
| 13 | CENTD2 | 60408 2510156 6100494 | 15112 | -0.415 | -0.6203 | Yes | ||
| 14 | FSCN1 | 3450463 | 17928 | -1.922 | -0.5740 | Yes | ||
| 15 | EVL | 1740113 | 18415 | -2.713 | -0.3211 | Yes | ||
| 16 | KPTN | 3520487 | 18539 | -3.228 | 0.0041 | Yes |

