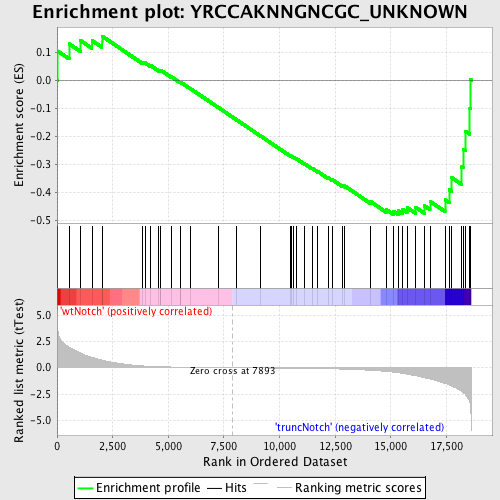
Profile of the Running ES Score & Positions of GeneSet Members on the Rank Ordered List
| Dataset | Set_03_truncNotch_versus_wtNotch.phenotype_truncNotch_versus_wtNotch.cls #wtNotch_versus_truncNotch.phenotype_truncNotch_versus_wtNotch.cls #wtNotch_versus_truncNotch_repos |
| Phenotype | phenotype_truncNotch_versus_wtNotch.cls#wtNotch_versus_truncNotch_repos |
| Upregulated in class | truncNotch |
| GeneSet | YRCCAKNNGNCGC_UNKNOWN |
| Enrichment Score (ES) | -0.47887835 |
| Normalized Enrichment Score (NES) | -1.1855341 |
| Nominal p-value | 0.15635179 |
| FDR q-value | 1.0 |
| FWER p-Value | 1.0 |
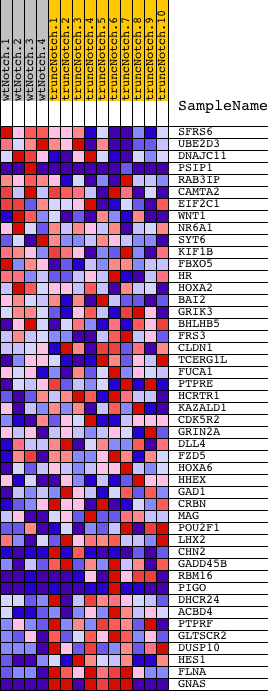
| PROBE | DESCRIPTION (from dataset) | GENE SYMBOL | GENE_TITLE | RANK IN GENE LIST | RANK METRIC SCORE | RUNNING ES | CORE ENRICHMENT | |
|---|---|---|---|---|---|---|---|---|
| 1 | SFRS6 | 60224 | 18 | 3.719 | 0.1037 | No | ||
| 2 | UBE2D3 | 3190452 | 542 | 1.915 | 0.1295 | No | ||
| 3 | DNAJC11 | 360465 3390215 | 1063 | 1.374 | 0.1402 | No | ||
| 4 | PSIP1 | 1780082 3190435 5050594 | 1568 | 0.987 | 0.1408 | No | ||
| 5 | RAB3IP | 5550100 | 2017 | 0.714 | 0.1368 | No | ||
| 6 | CAMTA2 | 3990075 | 2018 | 0.709 | 0.1568 | No | ||
| 7 | EIF2C1 | 6900551 | 3843 | 0.168 | 0.0633 | No | ||
| 8 | WNT1 | 4780148 | 3951 | 0.153 | 0.0618 | No | ||
| 9 | NR6A1 | 4010347 | 4212 | 0.126 | 0.0513 | No | ||
| 10 | SYT6 | 2510280 3850128 4540064 | 4578 | 0.097 | 0.0344 | No | ||
| 11 | KIF1B | 1240494 2370139 4570270 6510102 | 4651 | 0.092 | 0.0331 | No | ||
| 12 | FBXO5 | 2630551 | 4653 | 0.092 | 0.0357 | No | ||
| 13 | HR | 2690095 6200300 | 5136 | 0.067 | 0.0116 | No | ||
| 14 | HOXA2 | 2120121 | 5527 | 0.052 | -0.0080 | No | ||
| 15 | BAI2 | 380632 630113 6650170 | 5536 | 0.051 | -0.0069 | No | ||
| 16 | GRIK3 | 6380592 | 5990 | 0.037 | -0.0303 | No | ||
| 17 | BHLHB5 | 6510520 | 7259 | 0.010 | -0.0983 | No | ||
| 18 | FRS3 | 5890048 | 8077 | -0.003 | -0.1422 | No | ||
| 19 | CLDN1 | 5670746 | 9132 | -0.020 | -0.1984 | No | ||
| 20 | TCERG1L | 3360707 | 10508 | -0.047 | -0.2711 | No | ||
| 21 | FUCA1 | 610075 | 10520 | -0.047 | -0.2704 | No | ||
| 22 | PTPRE | 1660286 2940095 | 10630 | -0.050 | -0.2749 | No | ||
| 23 | HCRTR1 | 1580273 | 10738 | -0.052 | -0.2792 | No | ||
| 24 | KAZALD1 | 380603 | 11109 | -0.062 | -0.2973 | No | ||
| 25 | CDK5R2 | 3800110 | 11457 | -0.072 | -0.3140 | No | ||
| 26 | GRIN2A | 6550538 | 11714 | -0.080 | -0.3256 | No | ||
| 27 | DLL4 | 6400403 | 12189 | -0.098 | -0.3483 | No | ||
| 28 | FZD5 | 4070452 | 12360 | -0.107 | -0.3545 | No | ||
| 29 | HOXA6 | 2340333 | 12843 | -0.132 | -0.3767 | No | ||
| 30 | HHEX | 2340575 | 12925 | -0.138 | -0.3772 | No | ||
| 31 | GAD1 | 2360035 3140167 | 14087 | -0.240 | -0.4330 | No | ||
| 32 | CRBN | 2470070 3120427 3610044 6900452 | 14802 | -0.350 | -0.4615 | No | ||
| 33 | MAG | 2370037 | 15125 | -0.419 | -0.4671 | Yes | ||
| 34 | POU2F1 | 70577 430373 4850324 5910056 | 15328 | -0.468 | -0.4648 | Yes | ||
| 35 | LHX2 | 3610463 | 15527 | -0.532 | -0.4605 | Yes | ||
| 36 | CHN2 | 870528 | 15731 | -0.604 | -0.4544 | Yes | ||
| 37 | GADD45B | 2350408 | 16116 | -0.766 | -0.4535 | Yes | ||
| 38 | RBM16 | 6290286 6400181 | 16512 | -0.944 | -0.4482 | Yes | ||
| 39 | PIGO | 1400528 2340026 5340097 | 16762 | -1.050 | -0.4320 | Yes | ||
| 40 | DHCR24 | 840600 1050672 6290097 | 17438 | -1.483 | -0.4266 | Yes | ||
| 41 | ACBD4 | 6980079 | 17625 | -1.628 | -0.3908 | Yes | ||
| 42 | PTPRF | 1770528 3190044 | 17744 | -1.736 | -0.3483 | Yes | ||
| 43 | GLTSCR2 | 1940463 | 18188 | -2.229 | -0.3094 | Yes | ||
| 44 | DUSP10 | 2850673 3360064 | 18250 | -2.336 | -0.2469 | Yes | ||
| 45 | HES1 | 4810280 | 18347 | -2.504 | -0.1816 | Yes | ||
| 46 | FLNA | 5390193 | 18554 | -3.307 | -0.0996 | Yes | ||
| 47 | GNAS | 630441 1850373 4050152 | 18584 | -3.653 | 0.0017 | Yes |