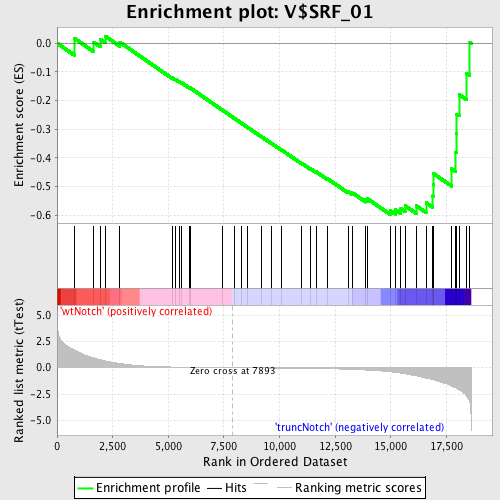
Profile of the Running ES Score & Positions of GeneSet Members on the Rank Ordered List
| Dataset | Set_03_truncNotch_versus_wtNotch.phenotype_truncNotch_versus_wtNotch.cls #wtNotch_versus_truncNotch.phenotype_truncNotch_versus_wtNotch.cls #wtNotch_versus_truncNotch_repos |
| Phenotype | phenotype_truncNotch_versus_wtNotch.cls#wtNotch_versus_truncNotch_repos |
| Upregulated in class | truncNotch |
| GeneSet | V$SRF_01 |
| Enrichment Score (ES) | -0.5979296 |
| Normalized Enrichment Score (NES) | -1.4398389 |
| Nominal p-value | 0.048309177 |
| FDR q-value | 0.8409756 |
| FWER p-Value | 0.993 |
| PROBE | DESCRIPTION (from dataset) | GENE SYMBOL | GENE_TITLE | RANK IN GENE LIST | RANK METRIC SCORE | RUNNING ES | CORE ENRICHMENT | |
|---|---|---|---|---|---|---|---|---|
| 1 | HOXB4 | 540131 | 766 | 1.681 | 0.0176 | No | ||
| 2 | CFL1 | 2340735 | 1650 | 0.941 | 0.0030 | No | ||
| 3 | SCOC | 610048 2230053 | 1945 | 0.761 | 0.0139 | No | ||
| 4 | SLC25A4 | 2360519 | 2158 | 0.642 | 0.0249 | No | ||
| 5 | VCL | 4120487 | 2812 | 0.405 | 0.0039 | No | ||
| 6 | EGR2 | 3800403 | 5178 | 0.065 | -0.1211 | No | ||
| 7 | TNMD | 3060520 | 5313 | 0.060 | -0.1262 | No | ||
| 8 | GPR20 | 6620601 | 5498 | 0.052 | -0.1343 | No | ||
| 9 | FOSB | 1940142 | 5598 | 0.049 | -0.1379 | No | ||
| 10 | THBS1 | 4560494 430288 | 5939 | 0.039 | -0.1549 | No | ||
| 11 | ACTR3 | 1400497 | 5984 | 0.037 | -0.1559 | No | ||
| 12 | IL17B | 6940711 | 7434 | 0.008 | -0.2337 | No | ||
| 13 | MYH11 | 7100273 | 7968 | -0.001 | -0.2623 | No | ||
| 14 | KCNMB1 | 4760139 | 8306 | -0.006 | -0.2802 | No | ||
| 15 | DIXDC1 | 6980435 | 8569 | -0.011 | -0.2940 | No | ||
| 16 | EGR4 | 3120750 | 9184 | -0.021 | -0.3263 | No | ||
| 17 | FOSL1 | 430021 | 9630 | -0.029 | -0.3492 | No | ||
| 18 | PHOX2B | 5270075 | 10099 | -0.038 | -0.3731 | No | ||
| 19 | IER2 | 2030008 | 10975 | -0.058 | -0.4182 | No | ||
| 20 | CALD1 | 1770129 1940397 | 11403 | -0.070 | -0.4387 | No | ||
| 21 | TNNC1 | 1990575 | 11645 | -0.077 | -0.4490 | No | ||
| 22 | CA3 | 870687 5890390 | 12159 | -0.097 | -0.4732 | No | ||
| 23 | ITGB1BP2 | 6200129 | 13080 | -0.148 | -0.5176 | No | ||
| 24 | TGFB1I1 | 2060288 6550450 | 13285 | -0.163 | -0.5228 | No | ||
| 25 | ACTG2 | 4780180 | 13871 | -0.217 | -0.5468 | No | ||
| 26 | PLCB3 | 4670402 | 13955 | -0.227 | -0.5433 | No | ||
| 27 | FOS | 1850315 | 14971 | -0.386 | -0.5844 | Yes | ||
| 28 | EGR3 | 6940128 | 15198 | -0.434 | -0.5814 | Yes | ||
| 29 | JUNB | 4230048 | 15452 | -0.504 | -0.5773 | Yes | ||
| 30 | MRVI1 | 4810338 4850601 5900441 | 15642 | -0.573 | -0.5675 | Yes | ||
| 31 | ANXA6 | 2190014 | 16137 | -0.771 | -0.5670 | Yes | ||
| 32 | TAZ | 7100193 | 16586 | -0.983 | -0.5567 | Yes | ||
| 33 | WDR1 | 1090129 3990121 | 16887 | -1.129 | -0.5334 | Yes | ||
| 34 | CAP1 | 2650278 | 16901 | -1.136 | -0.4943 | Yes | ||
| 35 | PFN1 | 6130132 | 16915 | -1.144 | -0.4549 | Yes | ||
| 36 | TPM1 | 130673 | 17733 | -1.728 | -0.4384 | Yes | ||
| 37 | CNN2 | 2230433 5270446 | 17910 | -1.904 | -0.3812 | Yes | ||
| 38 | EGR1 | 4610347 | 17946 | -1.942 | -0.3151 | Yes | ||
| 39 | MUS81 | 6660184 | 17964 | -1.968 | -0.2471 | Yes | ||
| 40 | MYL6 | 60563 6100152 | 18078 | -2.094 | -0.1798 | Yes | ||
| 41 | ASB2 | 4760168 | 18396 | -2.652 | -0.1040 | Yes | ||
| 42 | FLNA | 5390193 | 18554 | -3.307 | 0.0033 | Yes |

