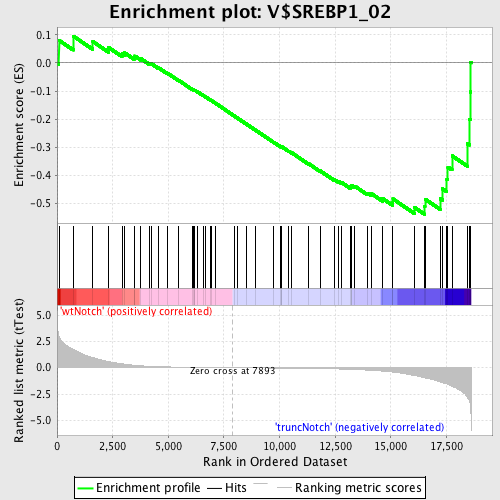
Profile of the Running ES Score & Positions of GeneSet Members on the Rank Ordered List
| Dataset | Set_03_truncNotch_versus_wtNotch.phenotype_truncNotch_versus_wtNotch.cls #wtNotch_versus_truncNotch.phenotype_truncNotch_versus_wtNotch.cls #wtNotch_versus_truncNotch_repos |
| Phenotype | phenotype_truncNotch_versus_wtNotch.cls#wtNotch_versus_truncNotch_repos |
| Upregulated in class | truncNotch |
| GeneSet | V$SREBP1_02 |
| Enrichment Score (ES) | -0.53942734 |
| Normalized Enrichment Score (NES) | -1.4062132 |
| Nominal p-value | 0.032206118 |
| FDR q-value | 0.7449133 |
| FWER p-Value | 0.998 |
| PROBE | DESCRIPTION (from dataset) | GENE SYMBOL | GENE_TITLE | RANK IN GENE LIST | RANK METRIC SCORE | RUNNING ES | CORE ENRICHMENT | |
|---|---|---|---|---|---|---|---|---|
| 1 | PTMA | 5570148 | 84 | 2.957 | 0.0808 | No | ||
| 2 | MORF4L2 | 6450133 | 727 | 1.716 | 0.0957 | No | ||
| 3 | ZFYVE1 | 60440 | 1606 | 0.973 | 0.0765 | No | ||
| 4 | ELOVL5 | 3800170 | 2316 | 0.577 | 0.0549 | No | ||
| 5 | PACSIN3 | 4540369 4540400 5360037 6940129 | 2921 | 0.367 | 0.0330 | No | ||
| 6 | CHRM3 | 6110725 | 3040 | 0.328 | 0.0361 | No | ||
| 7 | FBS1 | 2570520 | 3463 | 0.231 | 0.0200 | No | ||
| 8 | BAZ2A | 730184 | 3493 | 0.226 | 0.0250 | No | ||
| 9 | YWHAE | 5310435 | 3768 | 0.178 | 0.0153 | No | ||
| 10 | NOTCH2 | 2570397 | 4149 | 0.131 | -0.0013 | No | ||
| 11 | POU4F2 | 2120195 2570022 | 4242 | 0.124 | -0.0027 | No | ||
| 12 | SREBF2 | 3390692 | 4567 | 0.098 | -0.0174 | No | ||
| 13 | WDR13 | 3840520 4670064 | 4953 | 0.075 | -0.0359 | No | ||
| 14 | ATP2B2 | 3780397 | 5465 | 0.054 | -0.0619 | No | ||
| 15 | GFAP | 2060092 | 6081 | 0.035 | -0.0941 | No | ||
| 16 | UBE2B | 4780497 | 6134 | 0.033 | -0.0959 | No | ||
| 17 | DHRS3 | 360609 | 6168 | 0.033 | -0.0967 | No | ||
| 18 | SSTR3 | 5420064 | 6195 | 0.032 | -0.0972 | No | ||
| 19 | HS6ST2 | 520133 5550603 | 6314 | 0.029 | -0.1027 | No | ||
| 20 | HYAL1 | 3850341 | 6566 | 0.024 | -0.1156 | No | ||
| 21 | PLA2G3 | 5130739 | 6681 | 0.021 | -0.1211 | No | ||
| 22 | PLAG1 | 1450142 3870139 6520039 | 6905 | 0.017 | -0.1326 | No | ||
| 23 | FGF12 | 1740446 2360037 | 6943 | 0.016 | -0.1341 | No | ||
| 24 | RBP3 | 1400059 | 7112 | 0.013 | -0.1428 | No | ||
| 25 | ZFP36L1 | 2510138 4120048 | 7959 | -0.001 | -0.1884 | No | ||
| 26 | RARA | 4050161 | 8105 | -0.003 | -0.1961 | No | ||
| 27 | TOM1L1 | 4920056 3190070 | 8491 | -0.010 | -0.2166 | No | ||
| 28 | NF1 | 6980433 | 8913 | -0.017 | -0.2388 | No | ||
| 29 | GREM1 | 3940180 | 9722 | -0.030 | -0.2814 | No | ||
| 30 | CPA4 | 3610100 | 10055 | -0.037 | -0.2982 | No | ||
| 31 | BAI3 | 940692 | 10076 | -0.038 | -0.2982 | No | ||
| 32 | PHOX2B | 5270075 | 10099 | -0.038 | -0.2983 | No | ||
| 33 | NTN4 | 6940398 | 10413 | -0.045 | -0.3139 | No | ||
| 34 | SEZ6 | 3450722 | 10551 | -0.048 | -0.3199 | No | ||
| 35 | MEF2C | 670025 780338 | 11302 | -0.067 | -0.3584 | No | ||
| 36 | DLGAP4 | 4570672 5690161 | 11817 | -0.083 | -0.3837 | No | ||
| 37 | DPYSL2 | 2100427 3130112 5700324 | 12475 | -0.112 | -0.4159 | No | ||
| 38 | BCL6B | 60047 | 12648 | -0.121 | -0.4216 | No | ||
| 39 | CD2AP | 1940369 | 12804 | -0.130 | -0.4263 | No | ||
| 40 | FOXP2 | 3520561 4150372 4760524 | 13179 | -0.155 | -0.4419 | No | ||
| 41 | HOXB8 | 3710450 | 13220 | -0.158 | -0.4395 | No | ||
| 42 | INPP4A | 510215 1090541 4850093 6100519 | 13239 | -0.159 | -0.4359 | No | ||
| 43 | NOL4 | 5050446 5360519 | 13386 | -0.171 | -0.4388 | No | ||
| 44 | KTN1 | 70446 3450609 4560048 | 13962 | -0.227 | -0.4633 | No | ||
| 45 | NRGN | 4280433 | 14115 | -0.244 | -0.4644 | No | ||
| 46 | KIF1C | 2480484 | 14632 | -0.323 | -0.4829 | No | ||
| 47 | DDR1 | 2060044 5220180 | 15087 | -0.411 | -0.4955 | No | ||
| 48 | HOXB1 | 2120110 | 15095 | -0.412 | -0.4840 | No | ||
| 49 | SPI1 | 1410397 | 16074 | -0.748 | -0.5151 | Yes | ||
| 50 | GNB2 | 2350053 | 16526 | -0.952 | -0.5120 | Yes | ||
| 51 | CACNA2D3 | 4010184 | 16538 | -0.961 | -0.4848 | Yes | ||
| 52 | NDRG2 | 450403 | 17220 | -1.340 | -0.4828 | Yes | ||
| 53 | RAB33A | 6590195 | 17324 | -1.407 | -0.4478 | Yes | ||
| 54 | EIF5A | 1500059 5290022 6370026 | 17518 | -1.536 | -0.4139 | Yes | ||
| 55 | LOXL1 | 3520537 | 17566 | -1.577 | -0.3709 | Yes | ||
| 56 | POU2AF1 | 5690242 | 17754 | -1.745 | -0.3306 | Yes | ||
| 57 | CEBPB | 2970019 | 18441 | -2.781 | -0.2873 | Yes | ||
| 58 | RHOG | 6760575 | 18532 | -3.188 | -0.2002 | Yes | ||
| 59 | CORO1A | 3140609 3190020 3190037 | 18569 | -3.439 | -0.1029 | Yes | ||
| 60 | GNAS | 630441 1850373 4050152 | 18584 | -3.653 | 0.0017 | Yes |

