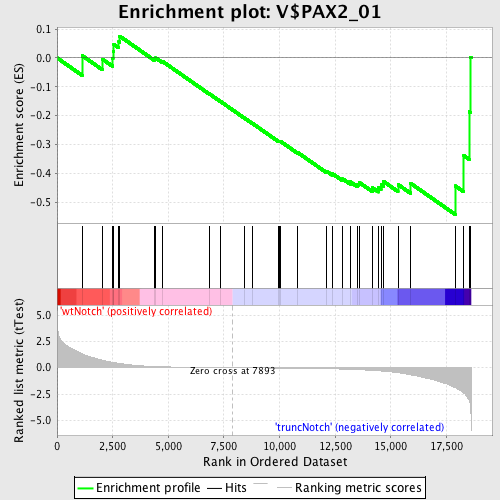
Profile of the Running ES Score & Positions of GeneSet Members on the Rank Ordered List
| Dataset | Set_03_truncNotch_versus_wtNotch.phenotype_truncNotch_versus_wtNotch.cls #wtNotch_versus_truncNotch.phenotype_truncNotch_versus_wtNotch.cls #wtNotch_versus_truncNotch_repos |
| Phenotype | phenotype_truncNotch_versus_wtNotch.cls#wtNotch_versus_truncNotch_repos |
| Upregulated in class | truncNotch |
| GeneSet | V$PAX2_01 |
| Enrichment Score (ES) | -0.54173964 |
| Normalized Enrichment Score (NES) | -1.2838892 |
| Nominal p-value | 0.12054329 |
| FDR q-value | 1.0 |
| FWER p-Value | 1.0 |
| PROBE | DESCRIPTION (from dataset) | GENE SYMBOL | GENE_TITLE | RANK IN GENE LIST | RANK METRIC SCORE | RUNNING ES | CORE ENRICHMENT | |
|---|---|---|---|---|---|---|---|---|
| 1 | TAF11 | 5720538 | 1128 | 1.306 | 0.0077 | No | ||
| 2 | MBNL1 | 2640762 7100048 | 2031 | 0.700 | -0.0041 | No | ||
| 3 | RBM3 | 2360739 5700167 | 2501 | 0.506 | -0.0028 | No | ||
| 4 | LRRFIP2 | 670575 730152 6590438 | 2514 | 0.500 | 0.0227 | No | ||
| 5 | ACADSB | 520170 | 2549 | 0.489 | 0.0465 | No | ||
| 6 | PDE10A | 520059 | 2775 | 0.415 | 0.0562 | No | ||
| 7 | VCL | 4120487 | 2812 | 0.405 | 0.0754 | No | ||
| 8 | JMJD1C | 940575 2120025 | 4363 | 0.113 | -0.0020 | No | ||
| 9 | HNRPH2 | 2630040 5720671 | 4431 | 0.107 | -0.0000 | No | ||
| 10 | GLA | 4610364 | 4744 | 0.086 | -0.0123 | No | ||
| 11 | NKX2-8 | 50022 | 6842 | 0.018 | -0.1242 | No | ||
| 12 | PCYT1B | 1780402 | 7342 | 0.009 | -0.1506 | No | ||
| 13 | TAF5 | 3450288 5890193 6860435 | 8422 | -0.008 | -0.2082 | No | ||
| 14 | FLRT1 | 4540348 | 8797 | -0.015 | -0.2276 | No | ||
| 15 | SEC14L1 | 2120551 3610537 | 9961 | -0.036 | -0.2883 | No | ||
| 16 | CDH16 | 1450129 | 10009 | -0.036 | -0.2889 | No | ||
| 17 | HDAC9 | 1990010 2260133 | 10024 | -0.037 | -0.2877 | No | ||
| 18 | NPAS2 | 770670 | 10825 | -0.054 | -0.3279 | No | ||
| 19 | BRUNOL6 | 6840373 | 12121 | -0.096 | -0.3926 | No | ||
| 20 | DMD | 1740041 3990332 | 12380 | -0.107 | -0.4009 | No | ||
| 21 | SPRR1A | 3870064 | 12840 | -0.132 | -0.4187 | No | ||
| 22 | FOXP2 | 3520561 4150372 4760524 | 13179 | -0.155 | -0.4287 | No | ||
| 23 | POU3F2 | 6620484 | 13503 | -0.181 | -0.4366 | No | ||
| 24 | PRDM13 | 1430022 | 13569 | -0.187 | -0.4303 | No | ||
| 25 | HOXA10 | 6110397 7100458 | 14167 | -0.252 | -0.4492 | Yes | ||
| 26 | RNF128 | 1230300 5670273 | 14442 | -0.289 | -0.4488 | Yes | ||
| 27 | ACCN2 | 6450465 | 14561 | -0.311 | -0.4389 | Yes | ||
| 28 | MAP1A | 4920576 | 14671 | -0.329 | -0.4275 | Yes | ||
| 29 | KCNE4 | 2470102 | 15324 | -0.467 | -0.4381 | Yes | ||
| 30 | CBX8 | 50671 | 15886 | -0.661 | -0.4337 | Yes | ||
| 31 | HIST1H4C | 5570528 | 17895 | -1.886 | -0.4429 | Yes | ||
| 32 | MAP2K5 | 2030440 | 18281 | -2.395 | -0.3381 | Yes | ||
| 33 | ADRB2 | 3290373 | 18525 | -3.156 | -0.1858 | Yes | ||
| 34 | ACTN4 | 3840301 4590390 7050132 | 18583 | -3.637 | 0.0018 | Yes |

